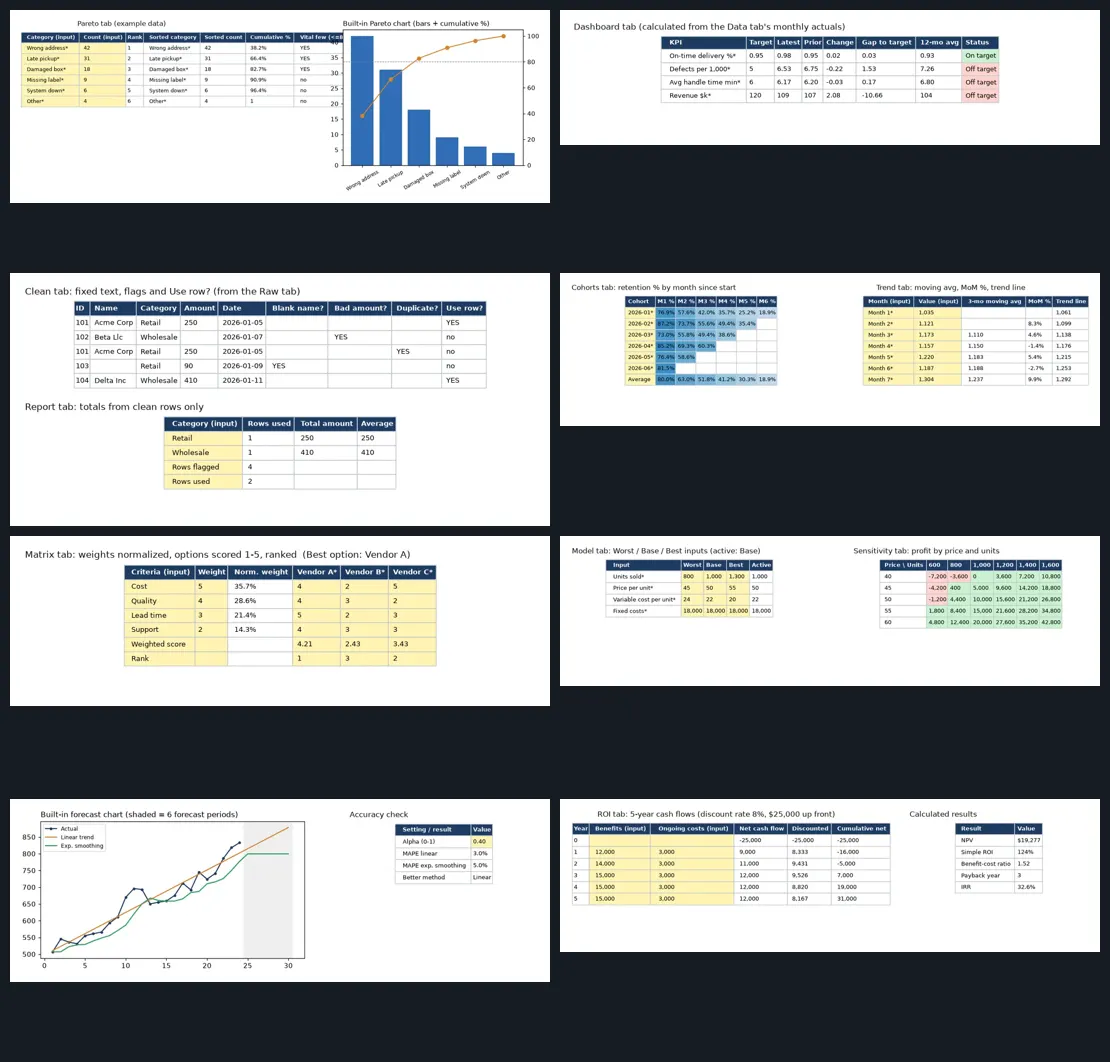
Free tools on our sites stay free. These templates are an optional paid upgrade. Browser apps are one HTML file that runs offline. Each spreadsheet template is an instant-download .xlsx with live formulas, marked input cells, example data and a Start Here tab. Try the free Pareto chart maker, control chart maker and FMEA RPN calculator. Photos are rendered from each app or workbook's own example data; swipe or scroll each gallery for more.
Training
Exam prep study apps. One HTML file that opens in your browser on phone or computer, works offline, no account.
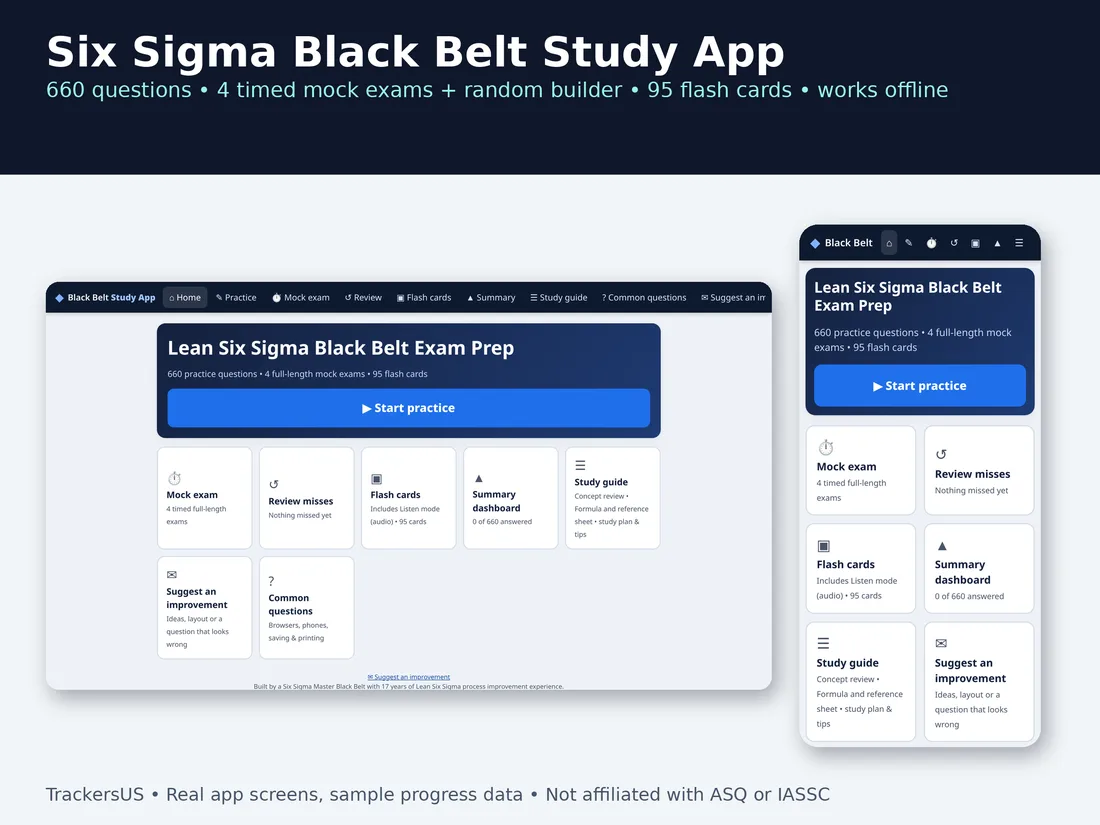
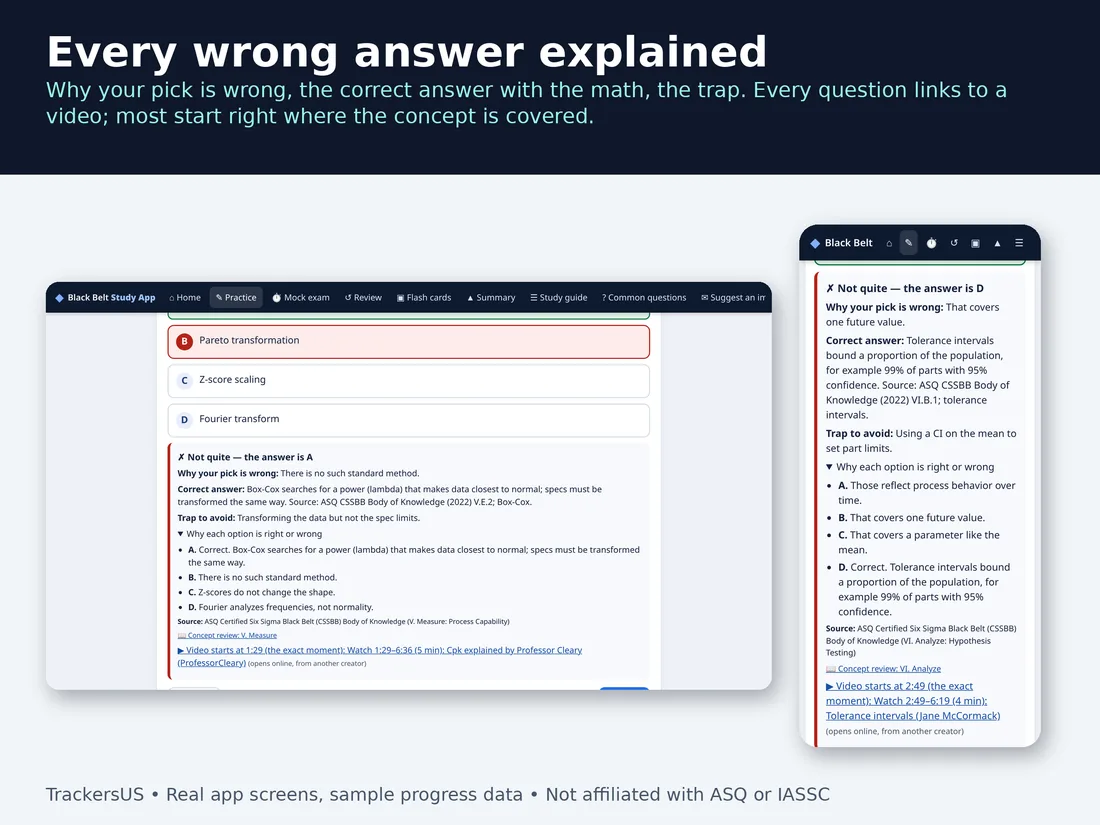
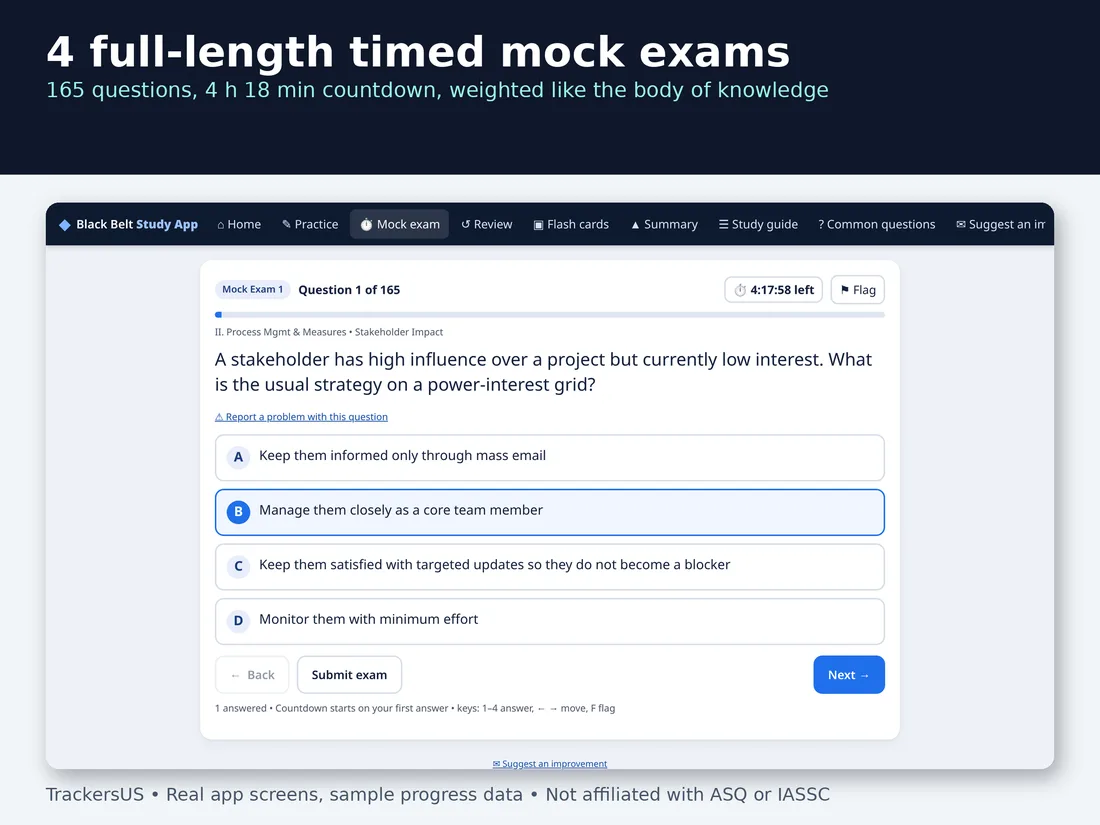
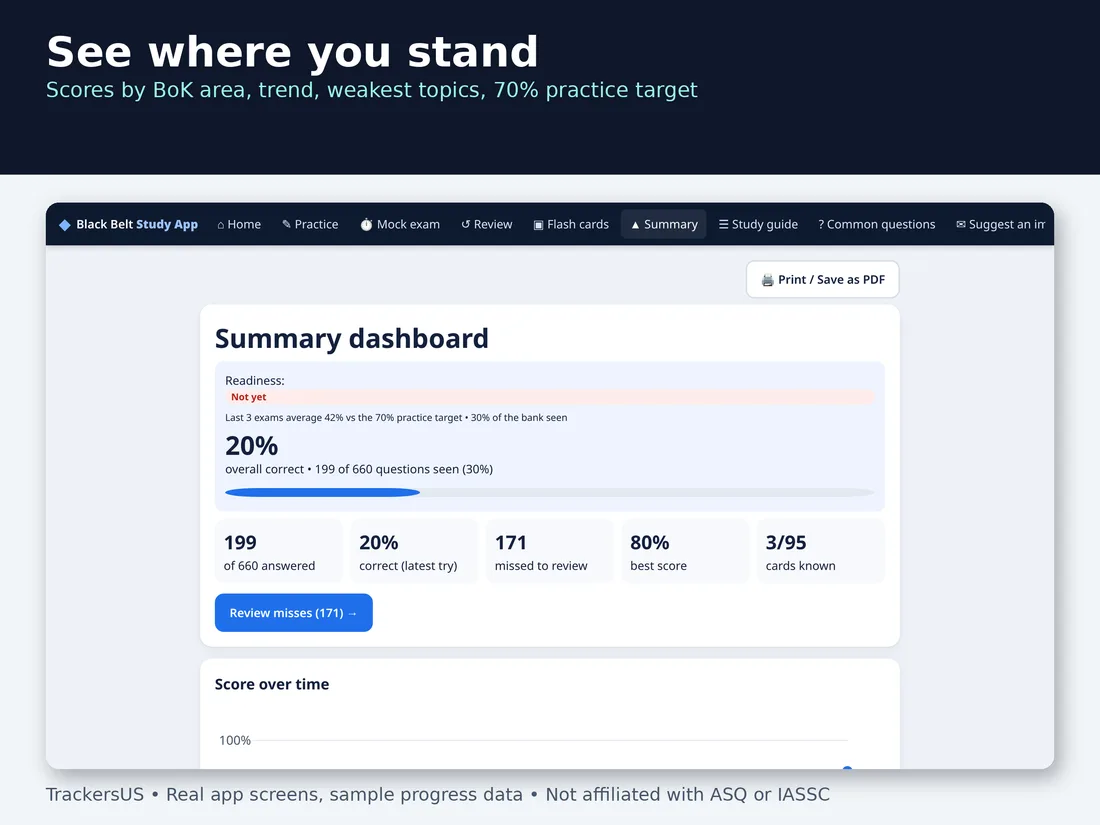
Six Sigma Black Belt Exam Prep App, Every Wrong Answer Explained, Video Links, 660 Questions, 4 Mock Exams, Works Offline
$34.50 USD · one-time payment
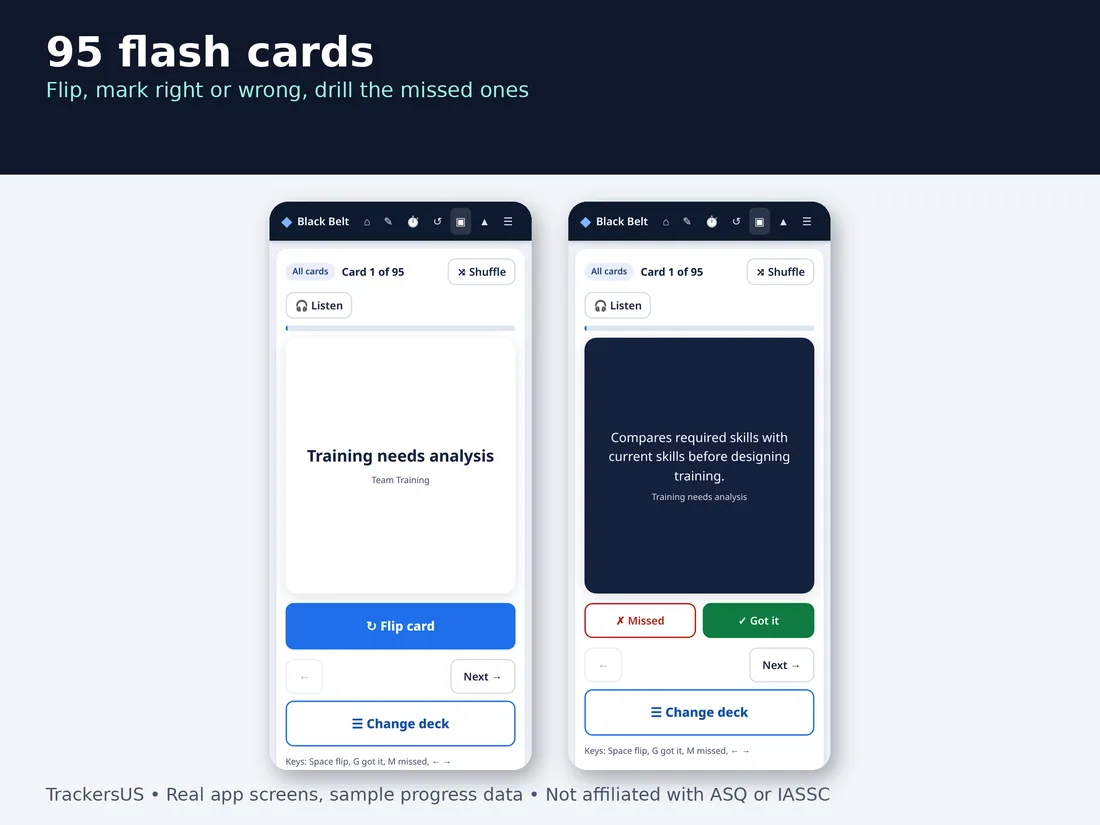
Black Belt exam prep study app: 660 original practice questions, 4 timed mock exams, a random exam builder and 95 flash cards in one file that opens in your browser on phone or computer.
Every wrong answer explained, and every question links to a video; most start right where the concept is covered. Works offline, no account, no login. Questions follow the nine areas of the published Black Belt body of knowledge, from organization-wide planning and team management through Define, Measure, Analyze, Improve, Control and DFSS, with hypothesis tests, regression, DOE and SPC math worked step by step.
HIGHLIGHTS
- Why the answer you picked is wrong, written for that exact choice, plus the correct answer step by step with the math
- The common trap, in one line, and a video link on every question (videos from other creators, not affiliated)
- 4 full-length mock exams (165 questions each, no repeats, 4 h 18 min countdown) weighted like the published body of knowledge
- Random exam builder: a new BoK-weighted 165-question exam from all 660 questions
- Review misses with a topic filter, then retake only those; retakes reshuffle questions and answers
- 95 flash cards with Listen mode (audio); dashboard with every attempt, scores by BoK area, trend, weakest topics and a 70% practice target
WHAT'S INCLUDED
- Black_Belt_Study_App.html: the full study app (Chrome, Safari, Edge or Firefox)
- START_HERE Getting Started PDF
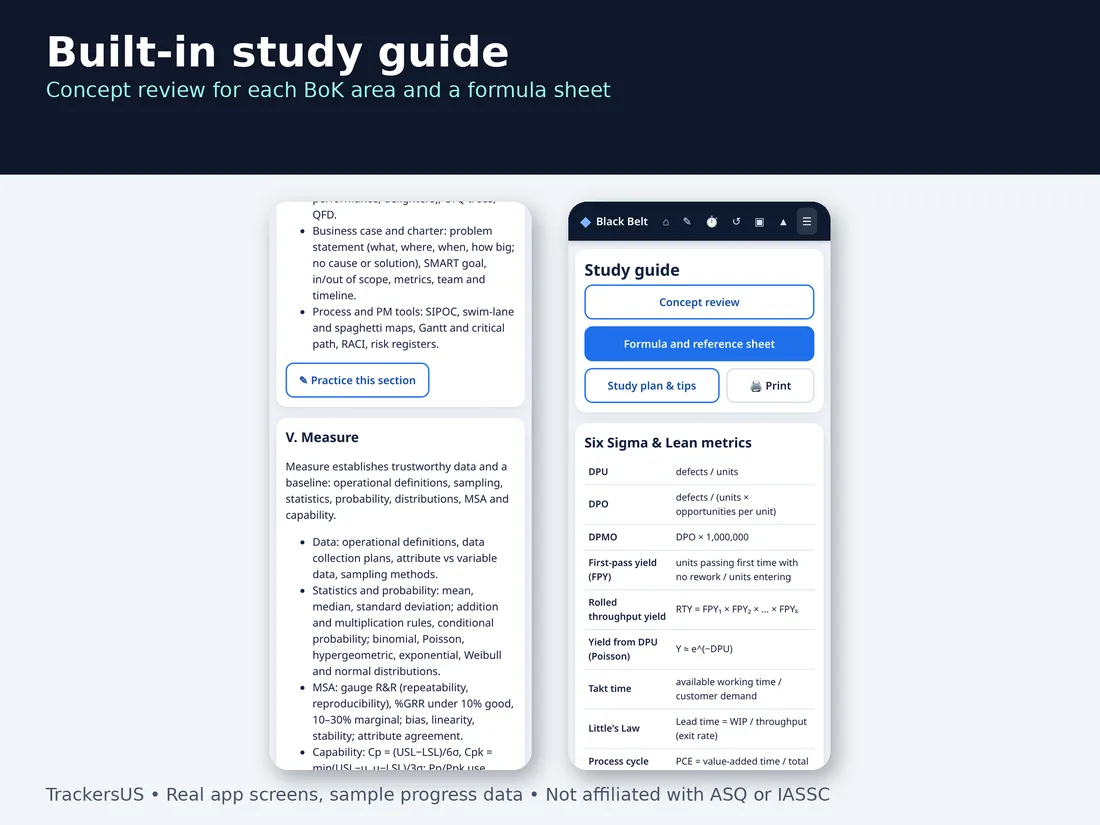
- Practice Questions PDF (concept review, 660 questions, full answer key), Formula Reference Sheet PDF, printable Flash Cards PDF
HOW TO USE
- Download from the link emailed after purchase.
- Open Black_Belt_Study_App.html in your browser and tap Start practice.
- Review your misses, then take a timed mock exam. Progress saves in that browser on that device.
Six Sigma Green Belt Exam Prep App, Every Wrong Answer Explained, Video Links, 527 Questions, 4 Mock Exams, Works Offline
$20.00 USD · one-time payment
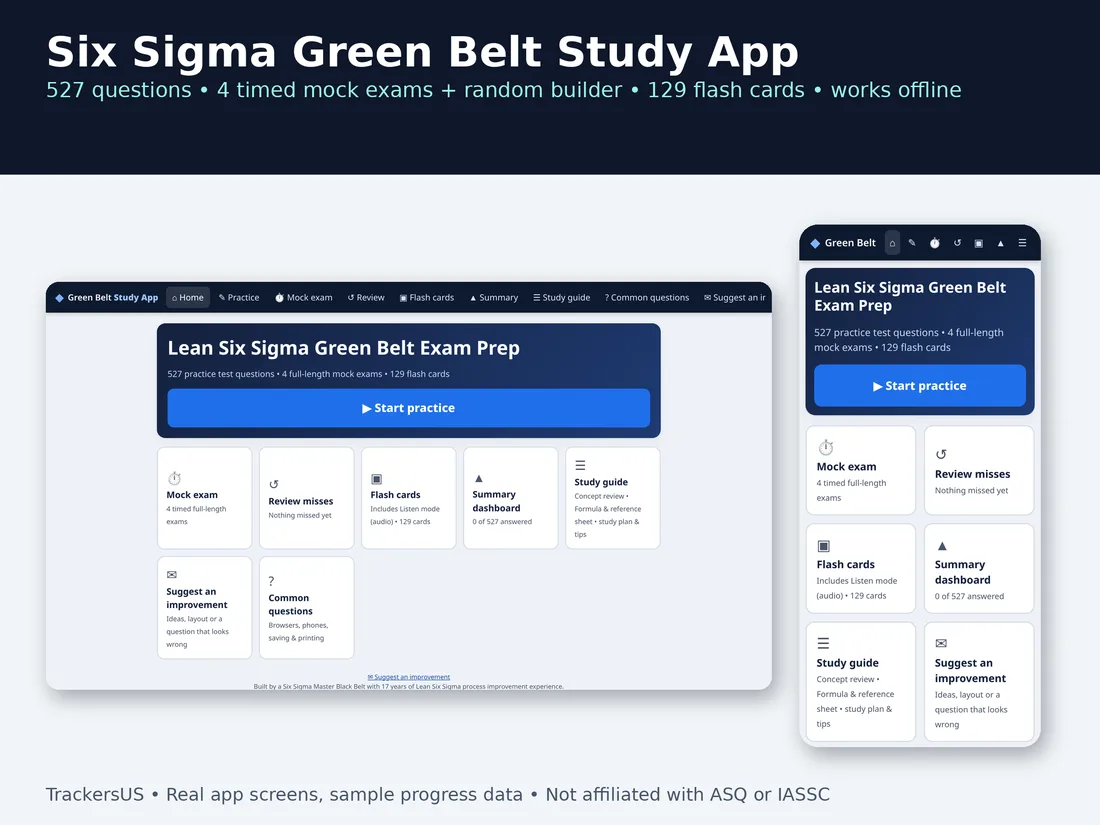
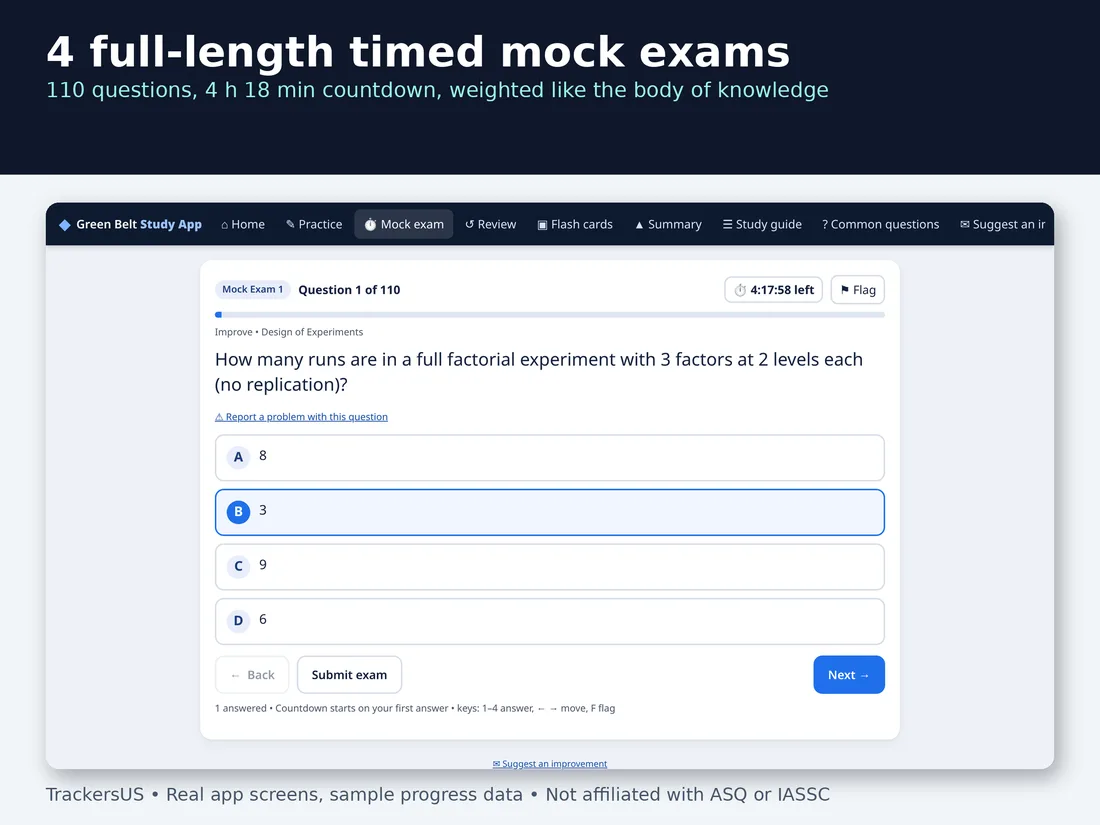
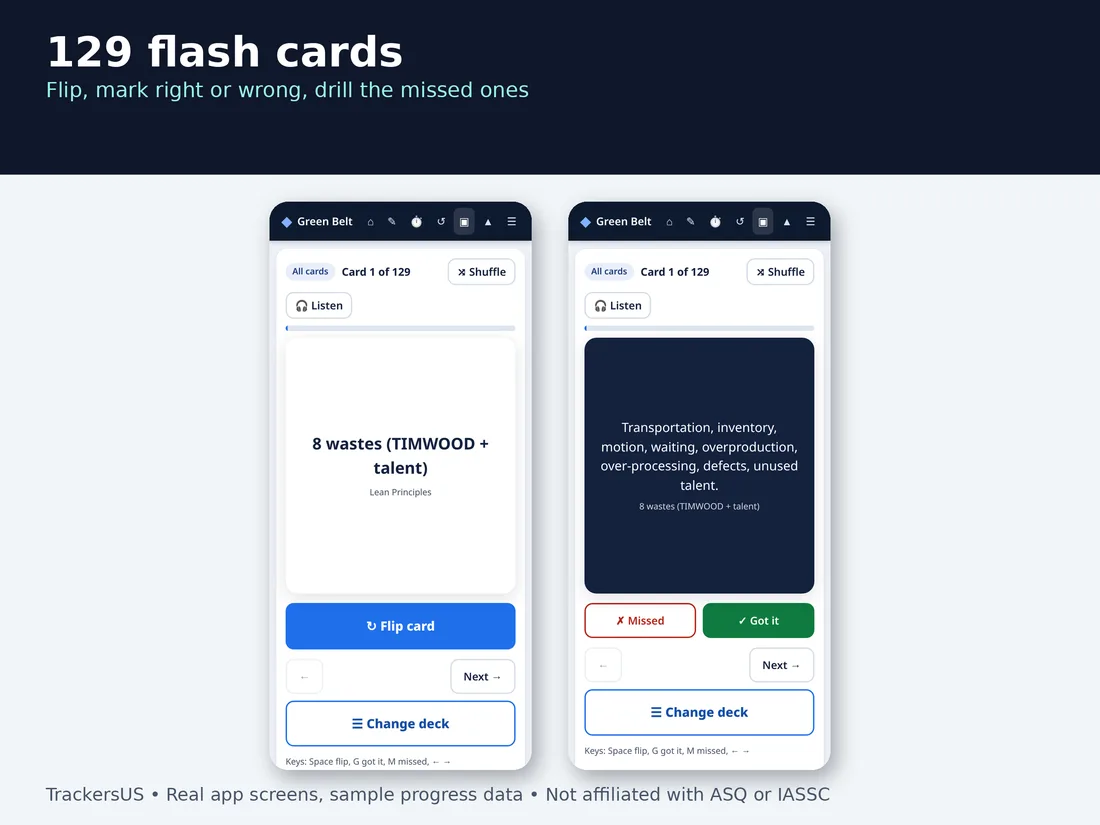
Six Sigma Green Belt exam prep study app: 527 original practice questions, 4 timed mock exams, a random exam builder and 129 flash cards in one file that opens in your browser on phone or computer.
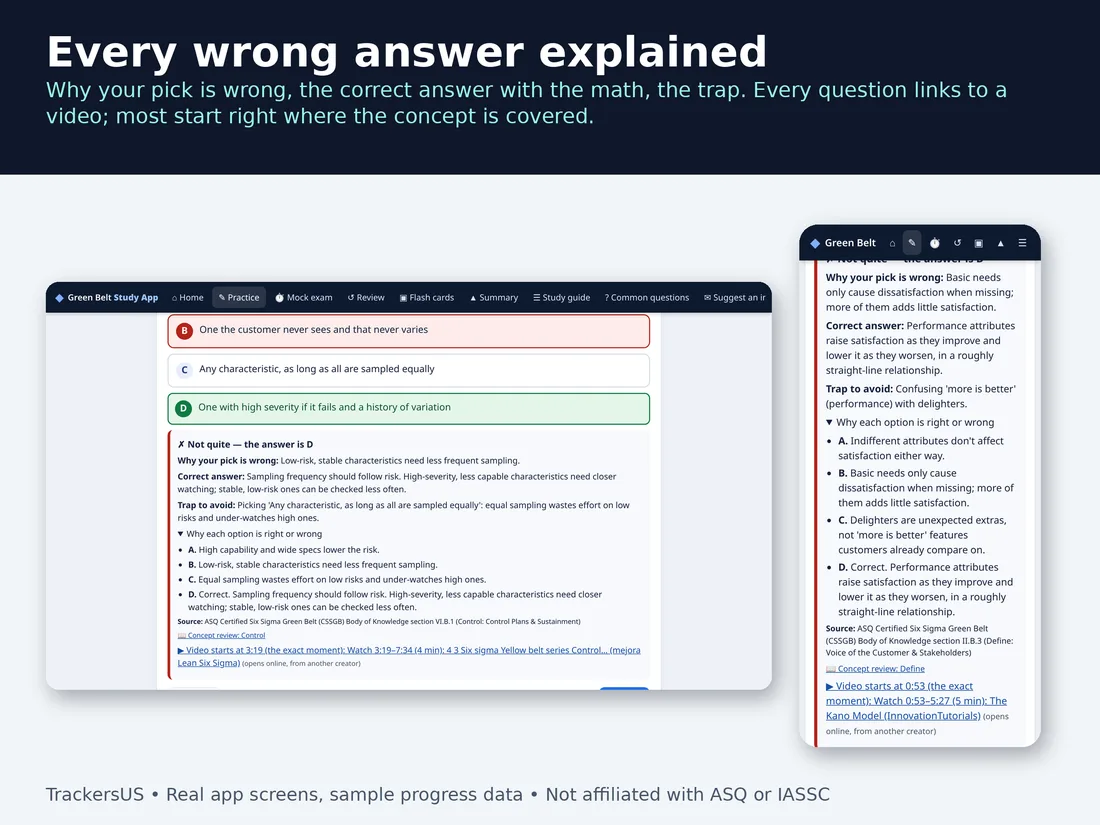
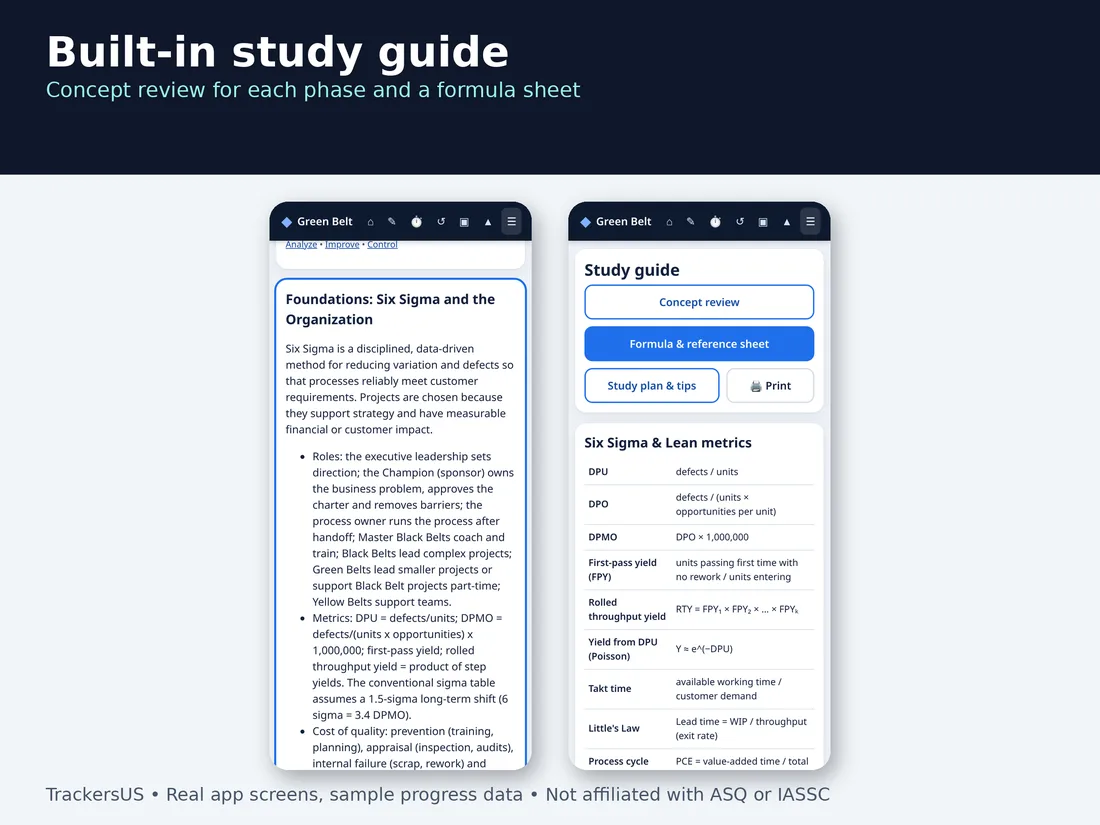
Every wrong answer explained, and every question links to a video; most start right where the concept is covered. Works offline, no account, no login. Questions follow the DMAIC phases and the published Green Belt body-of-knowledge topics, including Lean (wastes, flow, takt time, value stream mapping, 5S, kaizen, OEE).
HIGHLIGHTS
- Why the answer you picked is wrong, written for that exact choice, plus the correct answer step by step with the math
- The common trap, in one line, and a video link on every question (videos from other creators, not affiliated)
- 4 full-length mock exams (110 questions each, no repeats, 4 h 18 min countdown) weighted like the published body of knowledge
- Random exam builder: a new BoK-weighted 110-question exam from all 527 questions
- Review misses with a topic filter, then retake only those; retakes reshuffle questions and answers
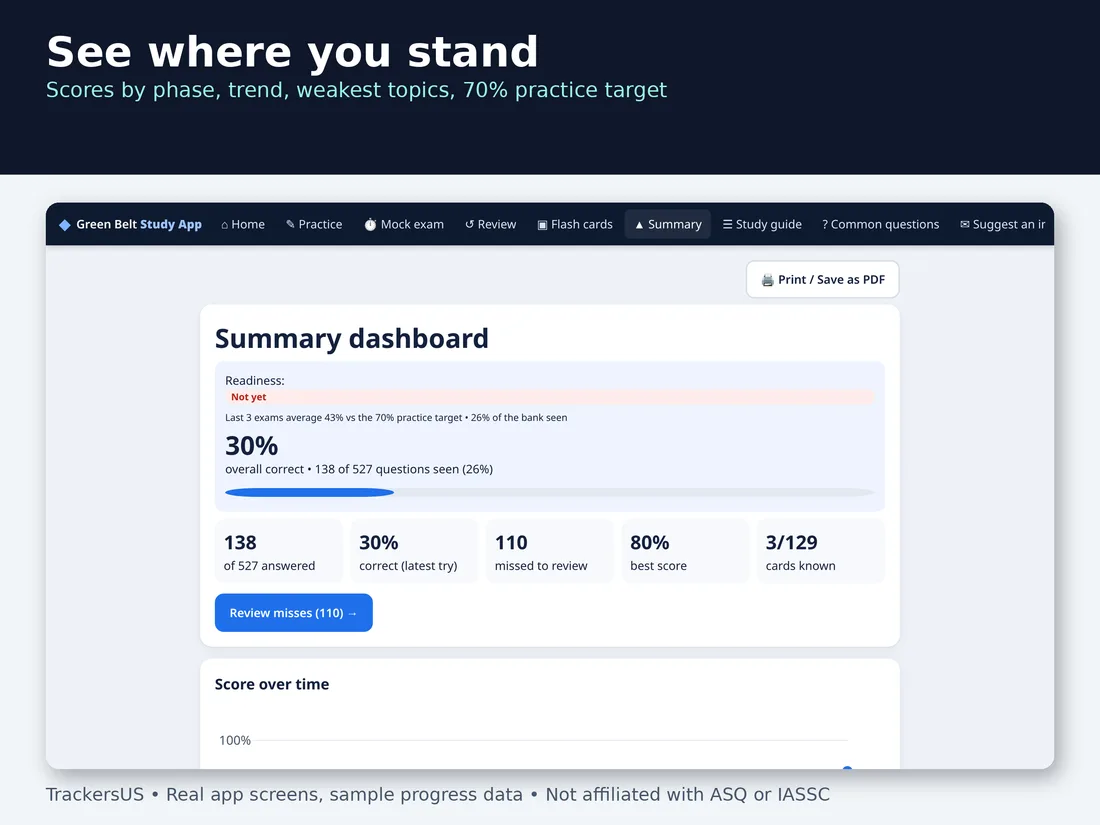
- 129 flash cards with Listen mode (audio); dashboard with every attempt, scores by phase, trend, weakest topics and a 70% practice target
WHAT'S INCLUDED
- Green_Belt_Study_App.html: the full study app (Chrome, Safari, Edge or Firefox)
- START_HERE Getting Started PDF
- Practice Questions PDF (concept review, 527 questions, full answer key), Formula Reference Sheet PDF, printable Flash Cards PDF
HOW TO USE
- Download from the link emailed after purchase.
- Open Green_Belt_Study_App.html in your browser and tap Start practice.
- Review your misses, then take a timed mock exam. Progress saves in that browser on that device.
Tools
Browser apps
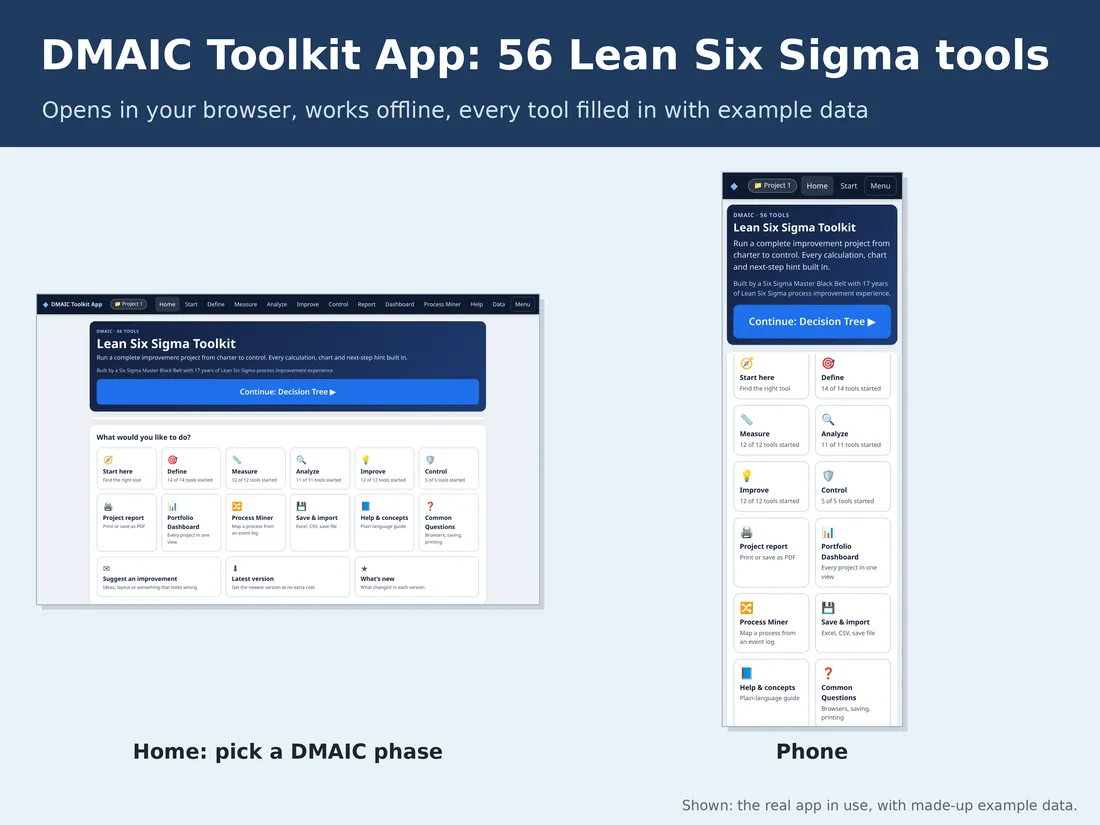
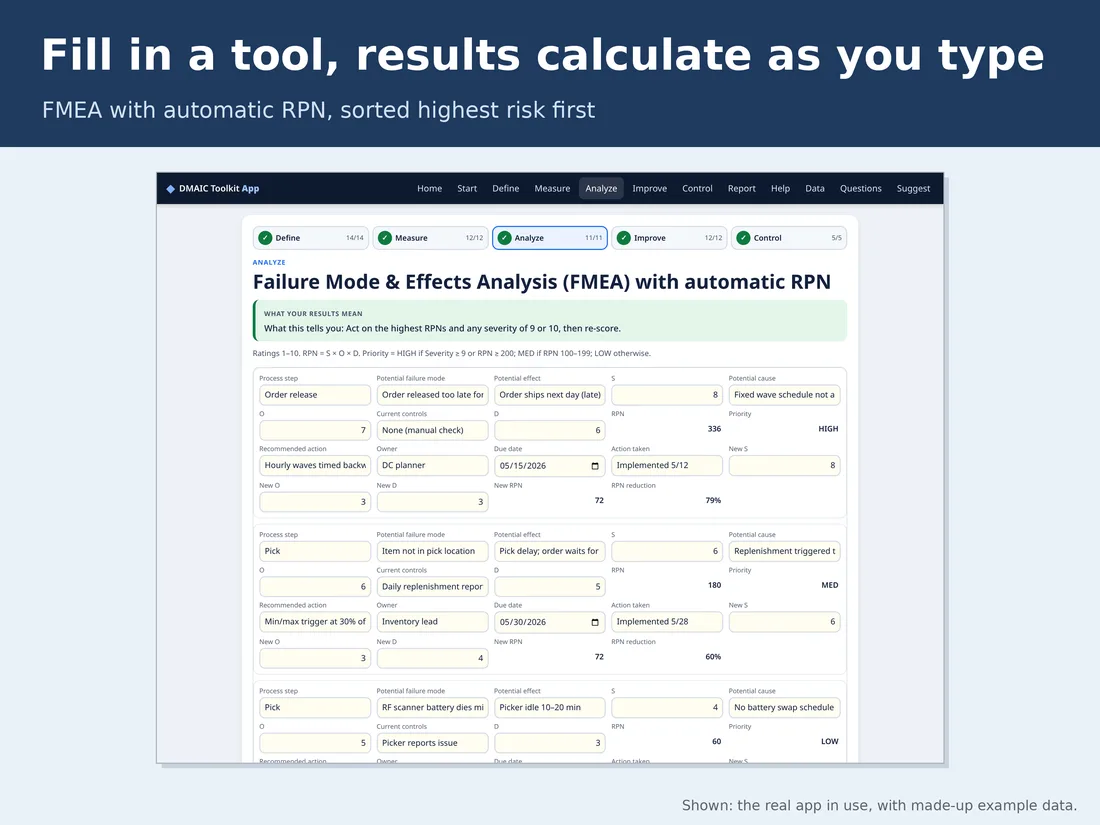
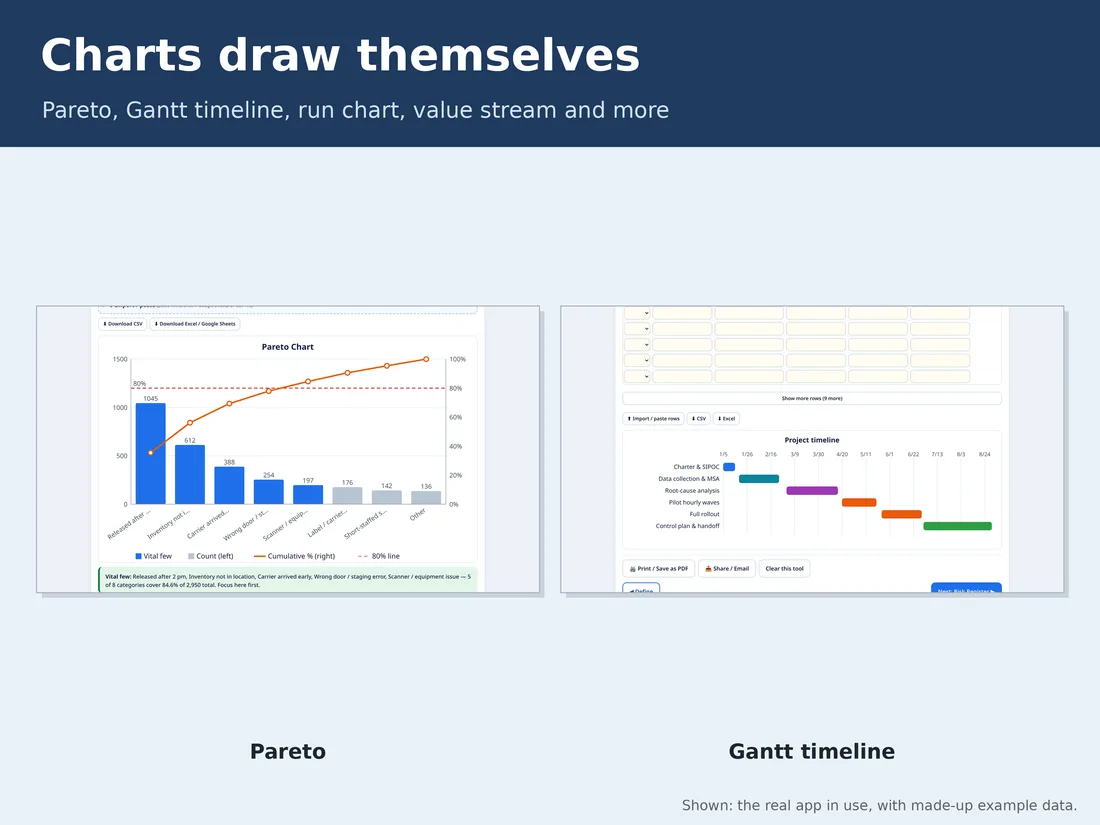
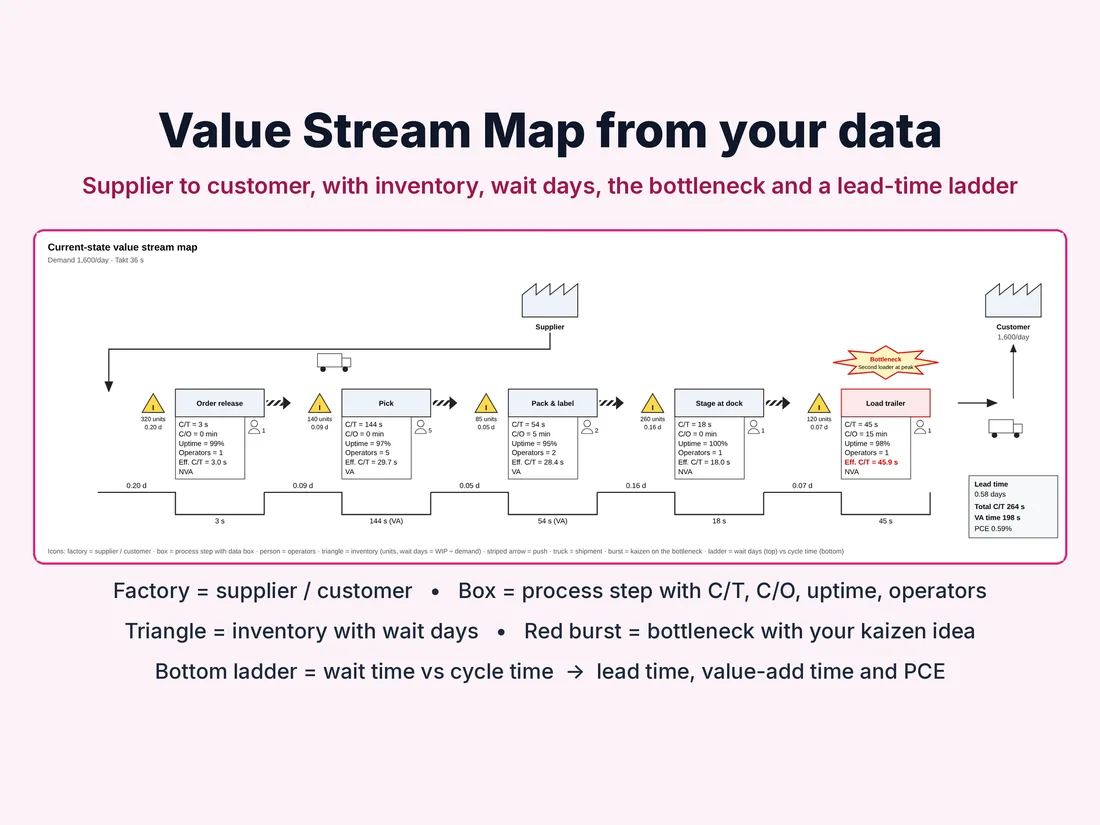
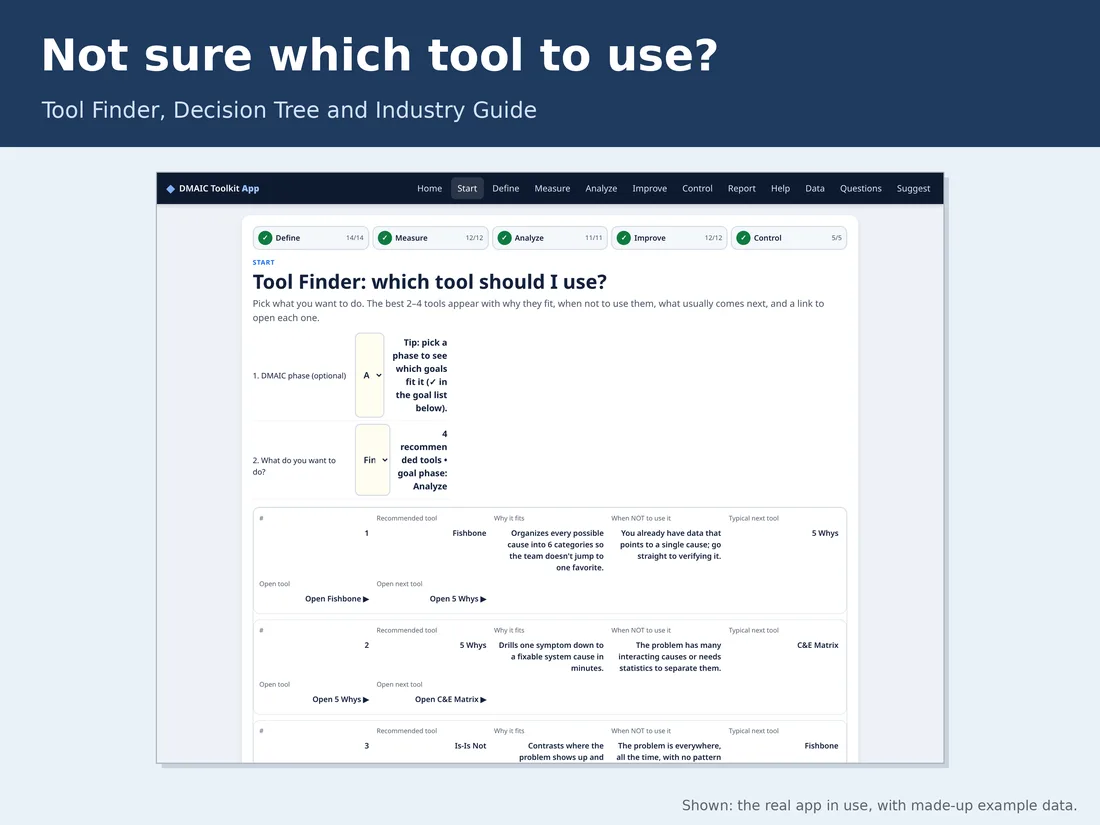
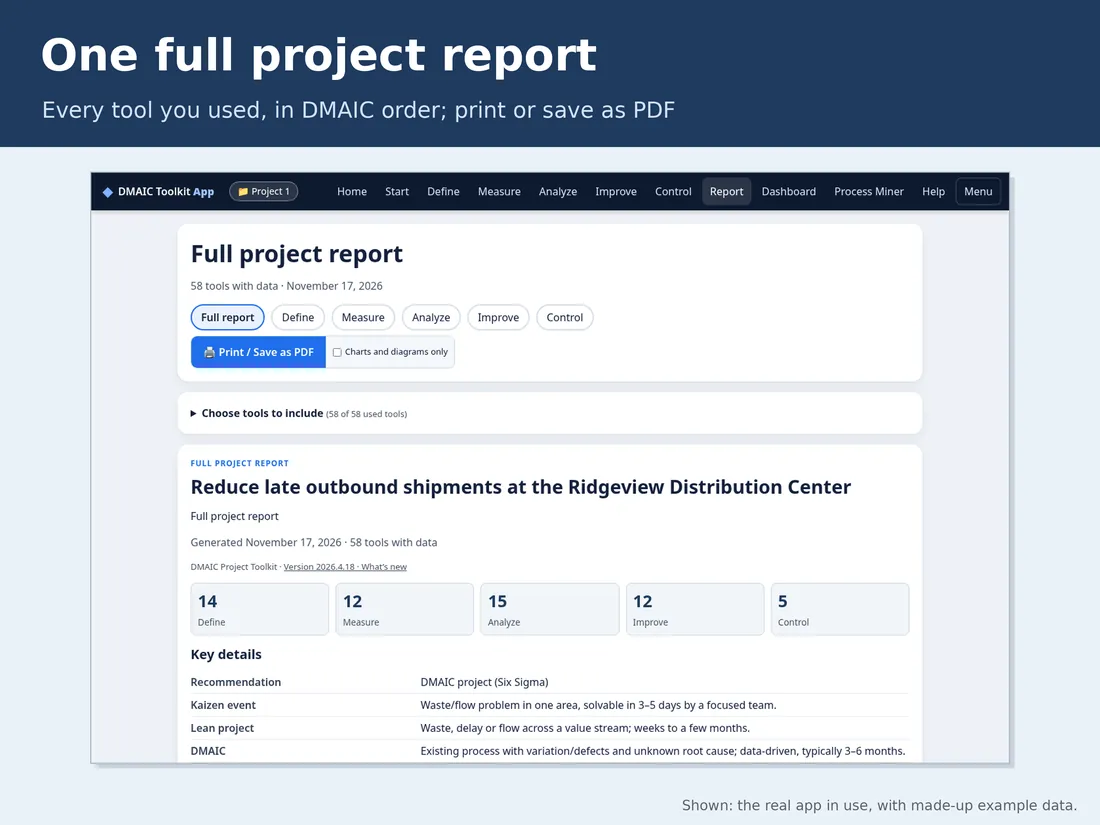
Lean Six Sigma Toolkit, DMAIC Template App (56 Tools, FMEA, VSM, A3, Green Belt, Black Belt Projects)
$35.00 USD · one-time payment
DMAIC toolkit app with 56 Lean Six Sigma tools in one offline browser app: FMEA, value stream map, Gage R&R, Pareto, charter and more, with example data loaded.
Every tool does the math: results calculate as you type, and a plain-English result box says what the numbers mean and which tool to use next.
HIGHLIGHTS
- Results as you type: FMEA RPN, sigma and DPMO, RTY, COPQ, OEE, Gage R&R, takt time, sample size, NPV and payback
- Charts draw themselves: Pareto, run chart, value stream timeline, Gantt, fishbone, 5S radar and more
- Tool Finder, methodology Decision Tree (Just Do It, Kaizen, Lean, DMAIC, DFSS or PDCA/A3), Industry Guide and Goal-Tool Matrix
- Example data in all 56 tools for 7 industries: General, Manufacturing, Healthcare, Office & financial services, Logistics, Software & IT, Call center
- A how-to video link on every one of the 59 screens (videos need internet and are made by their channels)
- Import or paste your data, export any table, Share / Email a summary, and Print / Save as PDF a full project report or one tool
WHAT'S INCLUDED
- DMAIC Toolkit App (.html): all 56 tools with example data in 7 industries
- Guide and Slides zip: Guide PDF and editable slide templates (.pptx) for the Project Charter, SIPOC, Fishbone, A3 and Value Stream Map
- Start Here PDF and Access Your Files PDF
HOW TO USE
- Download from the link emailed after purchase, then double-click DMAIC_Toolkit_App.html (Chrome, Edge, Safari or Firefox). No sign-up, no internet needed.
- Load example data to see a fully worked project, then clear it and start yours. Work autosaves.
- Print or save your phase or project report as PDF; use Data > Download save file to back up or move devices.
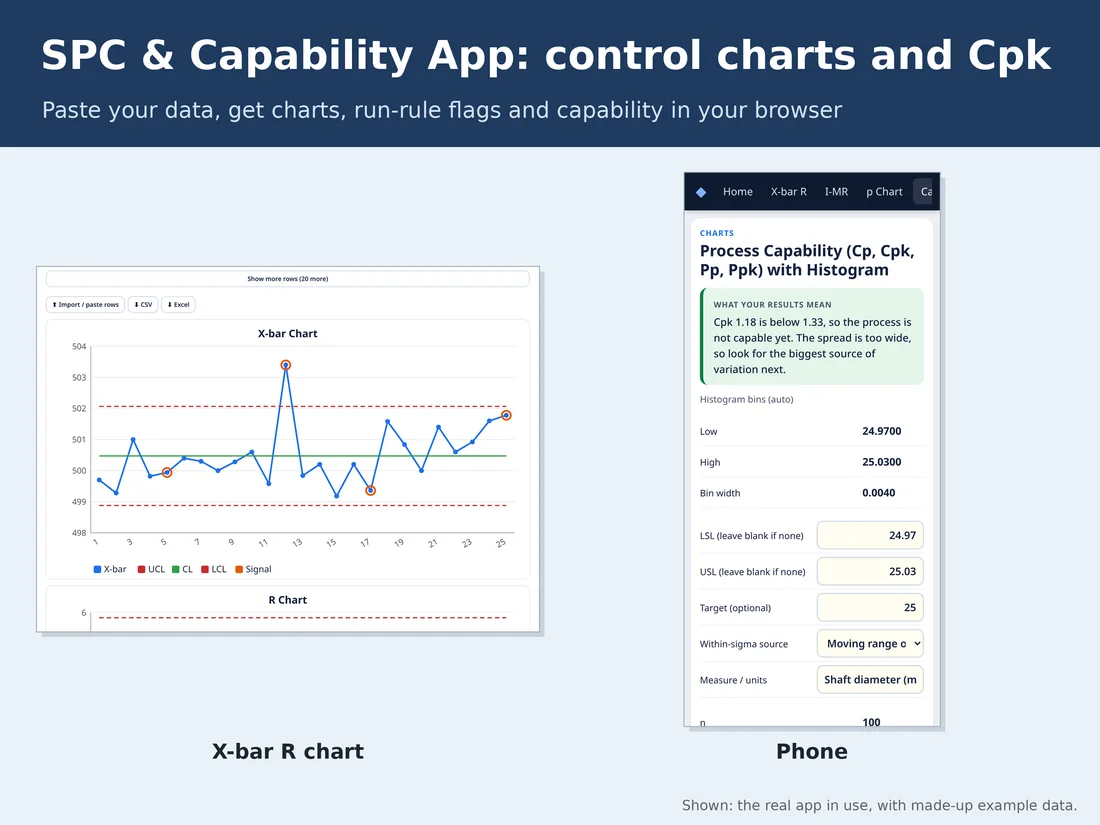
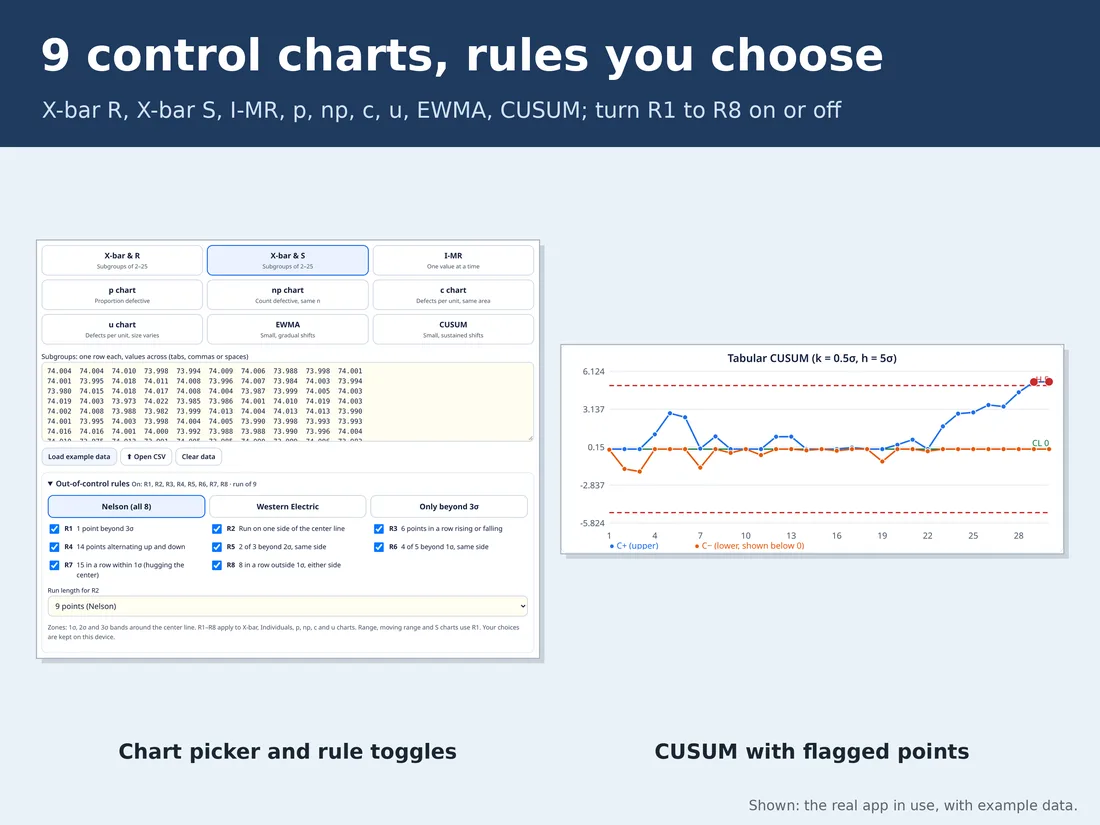
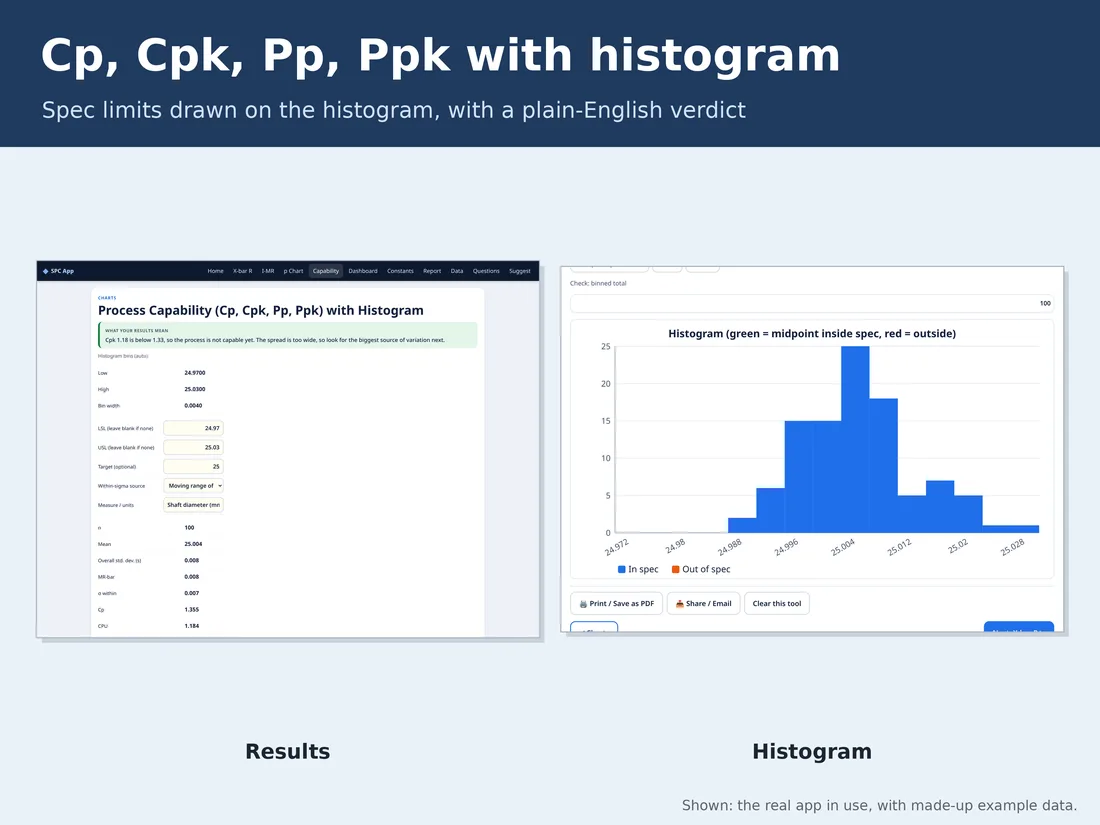
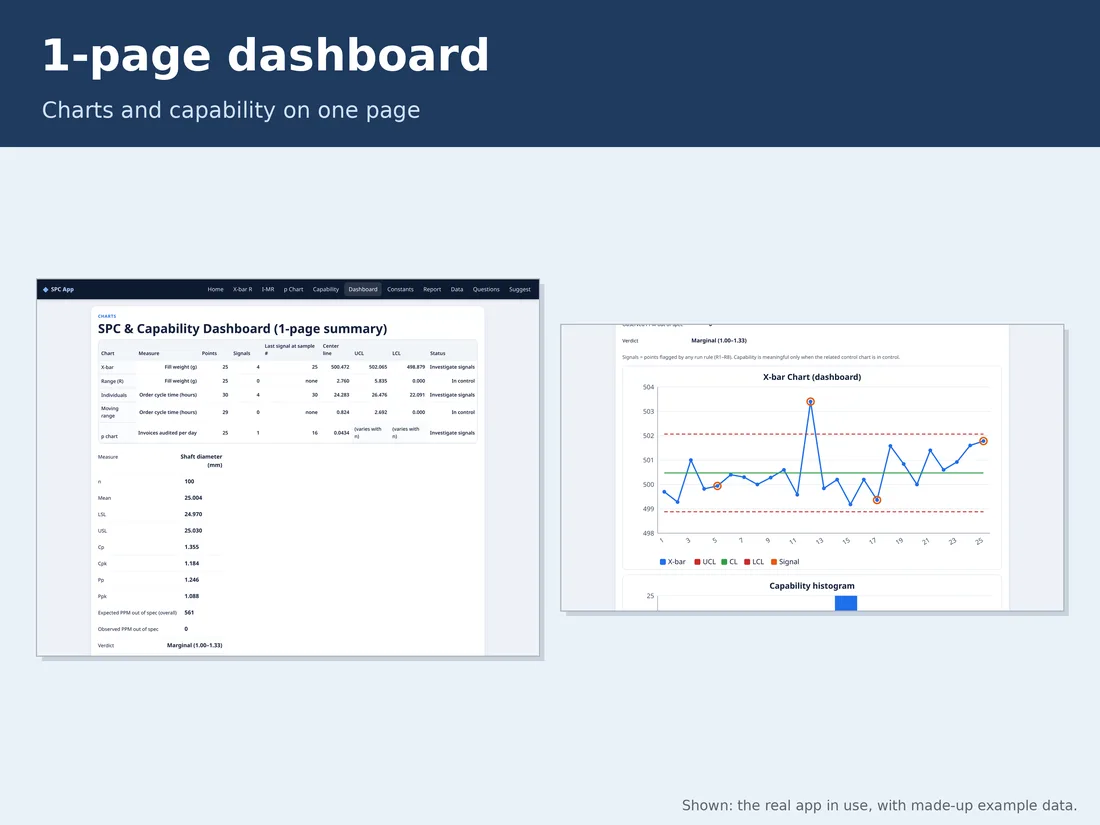
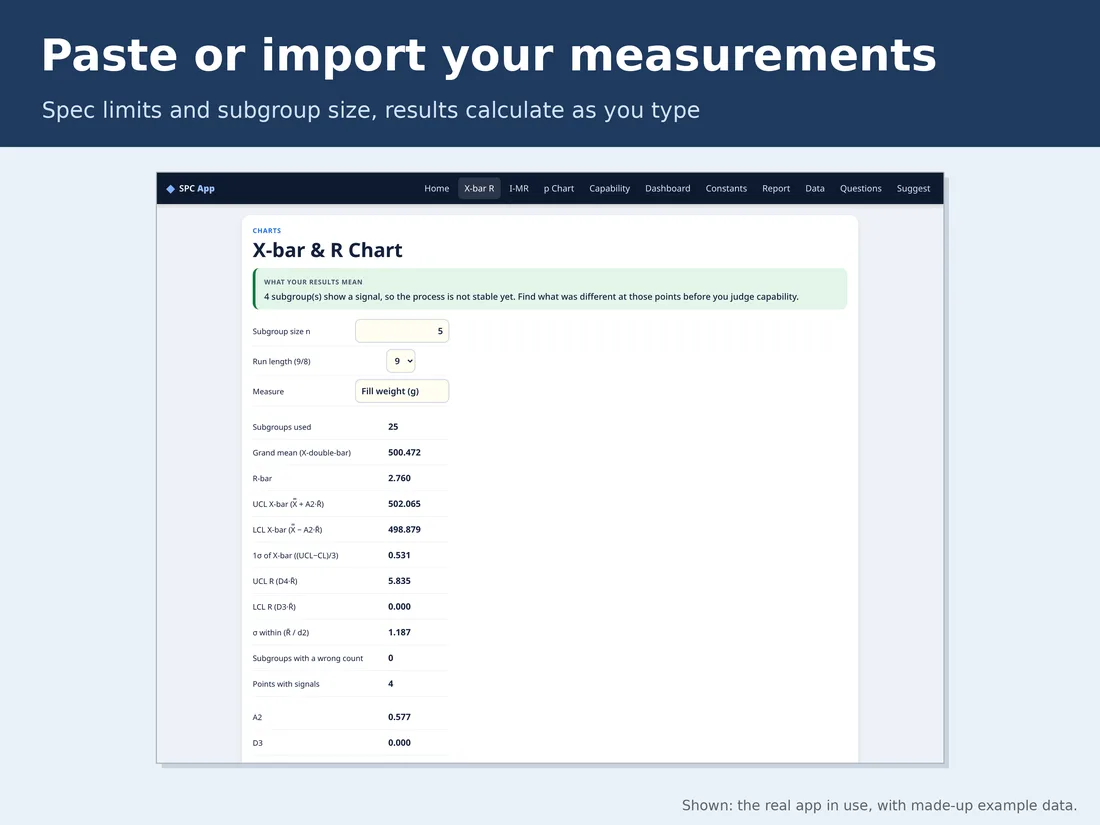
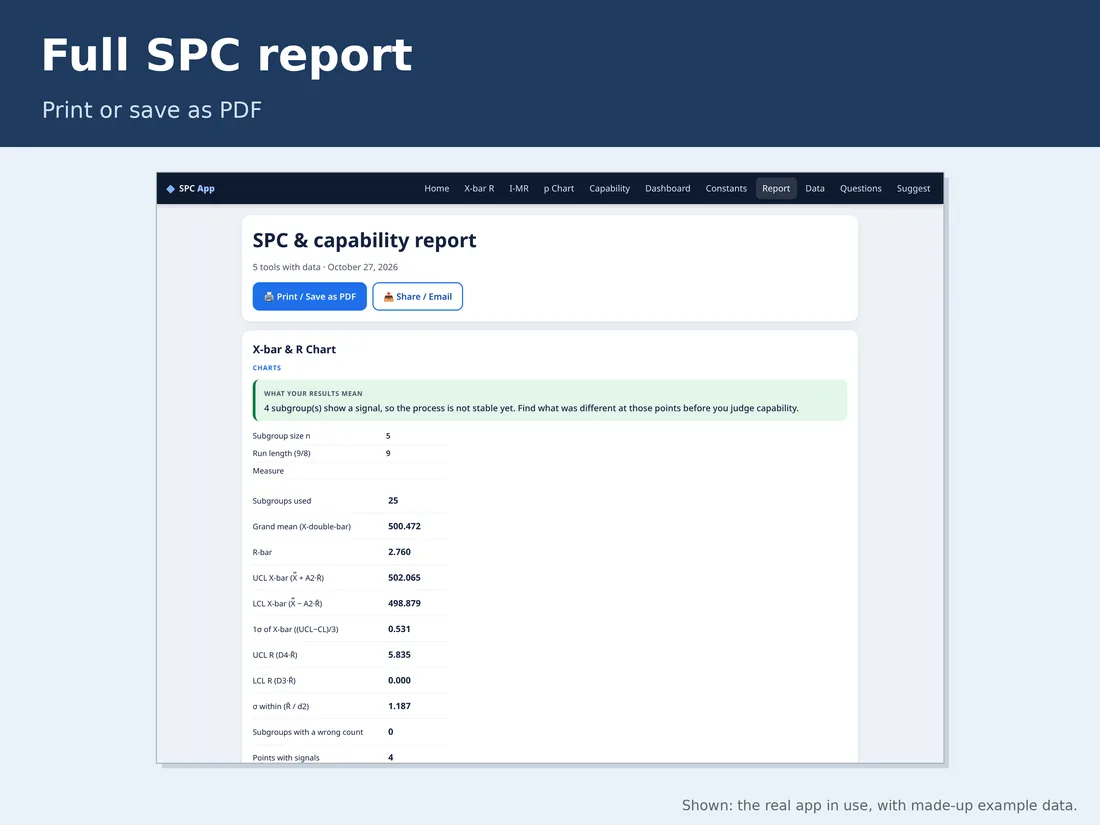
SPC Control Chart App (X-bar, Individuals, p, np, c, u, EWMA, CUSUM, Cpk, Nelson Rules, Works Offline)
$6.00 USD · one-time payment
SPC control chart app with 9 chart types (X-bar R, X-bar S, I-MR, p, np, c, u, EWMA, CUSUM) and Cp, Cpk, Pp, Ppk capability in one offline browser app, with sample data loaded.
Charts and capability, calculated for you: limits from the standard constants, signals flagged, and a plain-English verdict.
HIGHLIGHTS
- 9 control charts with limits from the standard constants (n = 2 to 25), UCL, CL and LCL drawn and flagged points marked
- p and u charts handle a different sample size on every point; EWMA (λ, L) and CUSUM (k, h) settings are yours to set
- Out-of-control rules R1 to R8, each on or off, with presets: Nelson (all 8), Western Electric, or Only beyond 3σ
- Capability: Cp, Cpk, Pp, Ppk, expected PPM out of spec and a histogram against your spec limits
- 1-page dashboard with the chart and capability results together
- Import or paste your data, export any table, Share / Email a summary, Print / Save as PDF a full report or one chart
WHAT'S INCLUDED
- SPC & Capability App (.html): 9 control charts, Capability, Dashboard and a constants table, with sample data
- SPC & Capability Guide PDF (chart choice, formulas, constants, run rules)
- Start Here PDF and Access Your Files PDF
HOW TO USE
- Download from the link emailed after purchase, then double-click SPC_Capability_App.html (Chrome, Edge, Safari or Firefox). No sign-up, no internet needed.
- Load example data to see it working, then enter or paste yours. Work autosaves.
- Read the flagged signals and capability verdict, then print or save the report as PDF.
Spreadsheet templates
Lean Six Sigma
Pareto Analysis Calculator
$7 USD · one-time payment
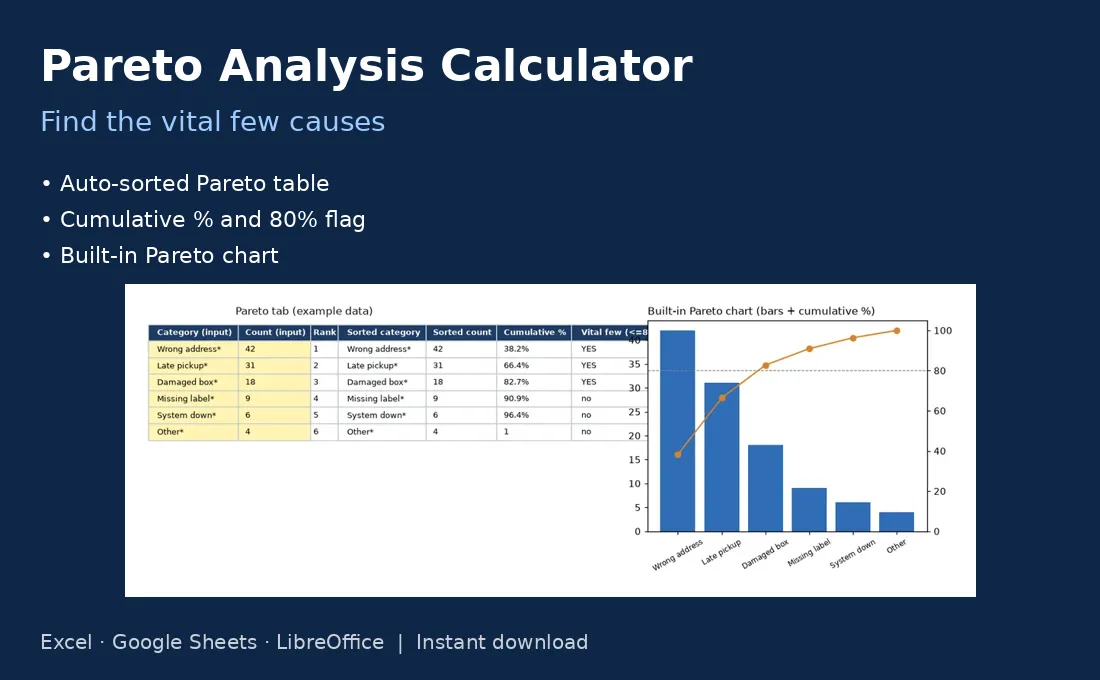
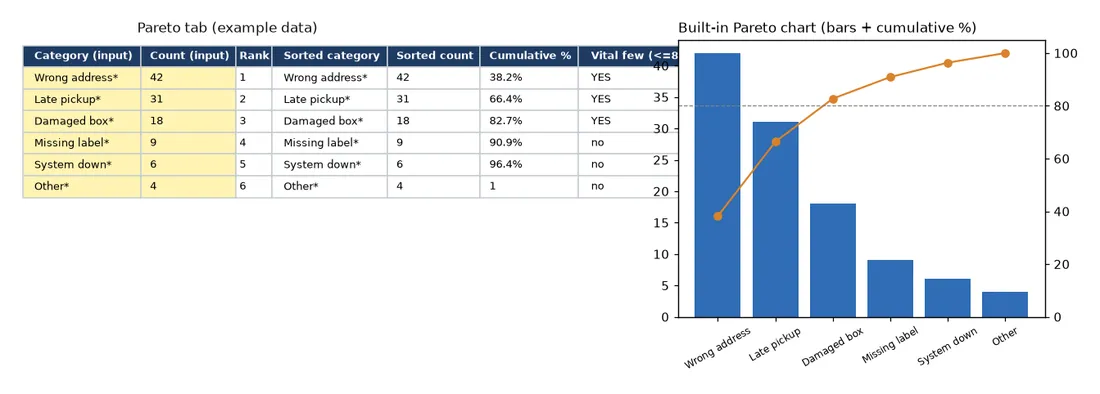
Enter categories and counts to get a sorted Pareto chart, cumulative % and the vital few flagged at 80%.
Rank complaints, defects or delays so you fix the few causes behind most of the problem first.
HIGHLIGHTS
- Type categories and counts; the table re-sorts itself, largest first
- Cumulative % with a YES flag on the vital few
- Built-in combo chart: count bars plus a cumulative % line
- Example: six shipping problems, ready to replace
WHAT'S INCLUDED
- Pareto tab: up to 30 category rows, rank, sorted table, cumulative %, vital-few flag and chart
- Start Here tab with instructions
- Works in Excel, Google Sheets and LibreOffice; yellow cells are inputs, EXAMPLE rows show how it works
HOW TO USE
- Type each category and how many times it happened.
- Read the sorted table: YES rows are your vital few.
- Paste the chart into your report or A3.
Business intelligence & analytics
KPI Dashboard
$12 USD · one-time payment
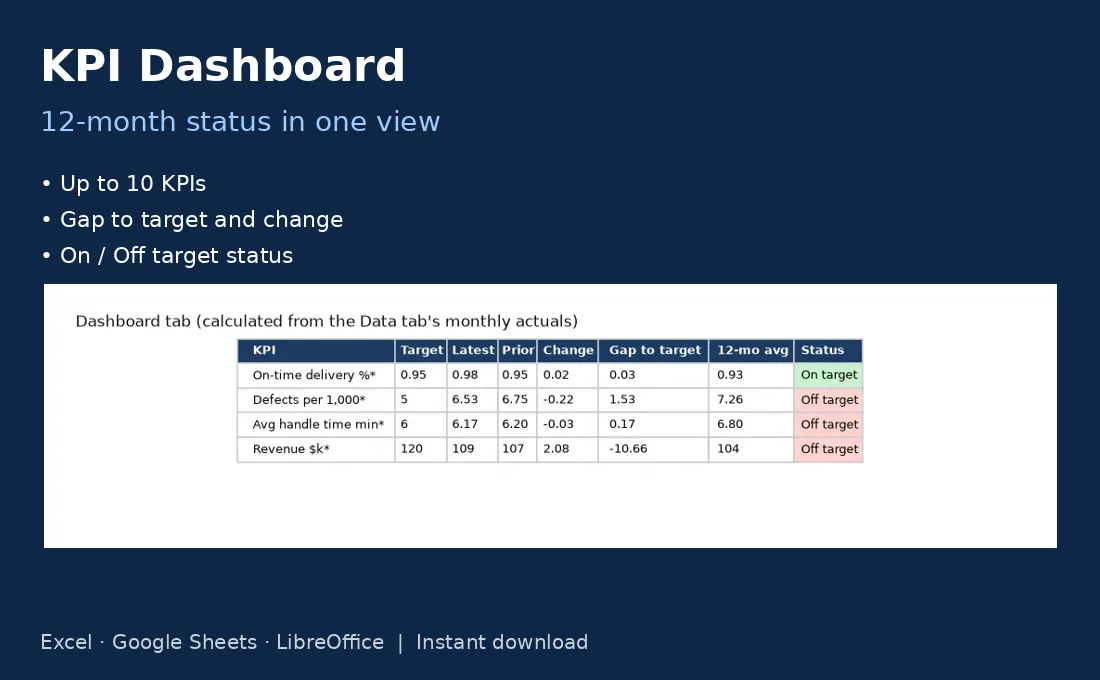
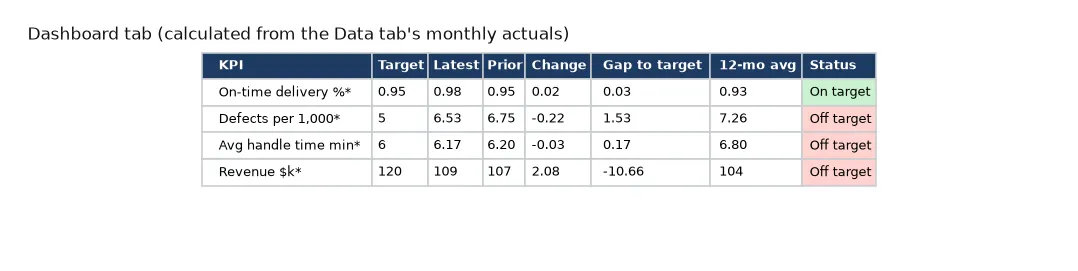
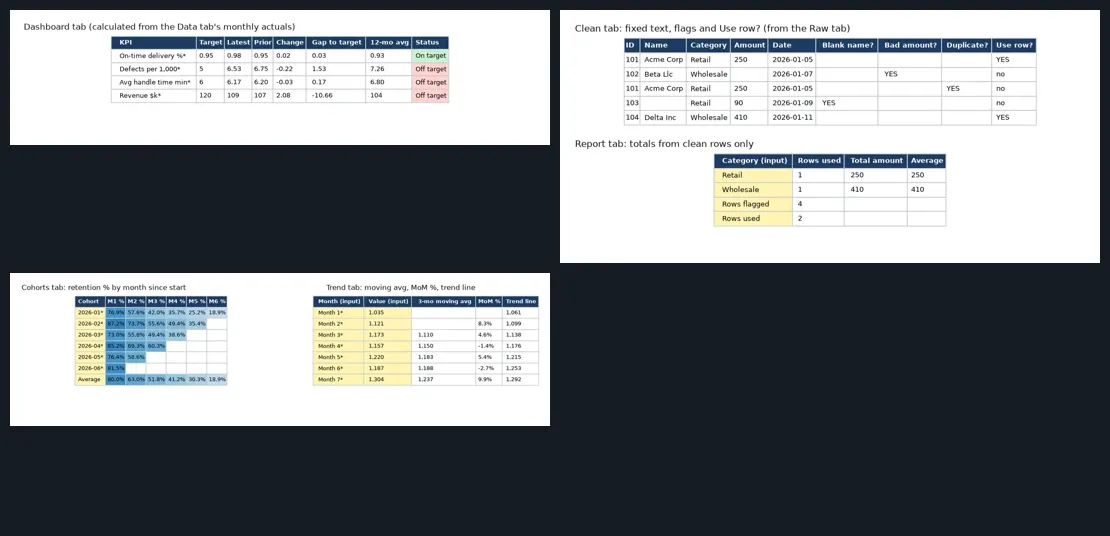
Track up to 10 KPIs over 12 months: latest vs prior, gap to target, 12-month average and color-coded status.
Turn a grid of monthly numbers into a one-screen status view, so the monthly review starts with what is off target.
HIGHLIGHTS
- Up to 10 KPIs with a target and a Higher-or-Lower-is-better setting
- Latest, prior month, change and gap to target
- 12-month average and an On target / Off target status that respects direction
- Tables only, no charts; works for any metric you already track
WHAT'S INCLUDED
- Data tab: KPI list with 12 monthly inputs
- Dashboard tab: calculated status table
- Start Here tab
- Works in Excel, Google Sheets and LibreOffice; yellow cells are inputs, EXAMPLE rows show how it works
HOW TO USE
- List your KPIs, targets and direction on the Data tab.
- Enter each month's actual as it comes in.
- Open the Dashboard tab to see what is on or off target.
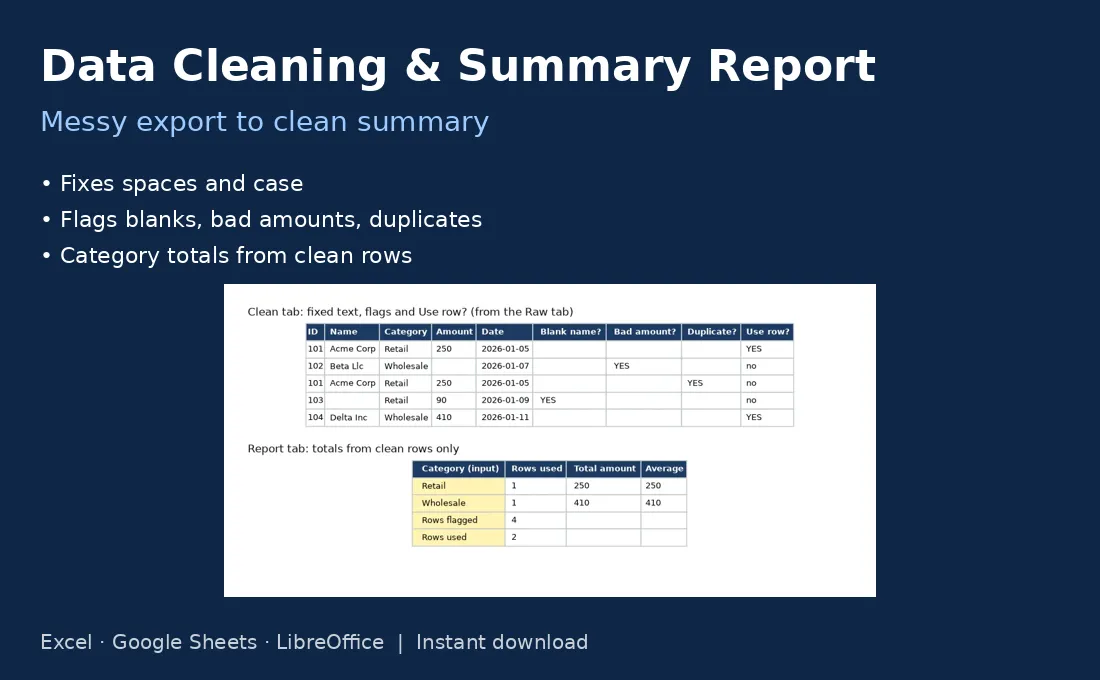
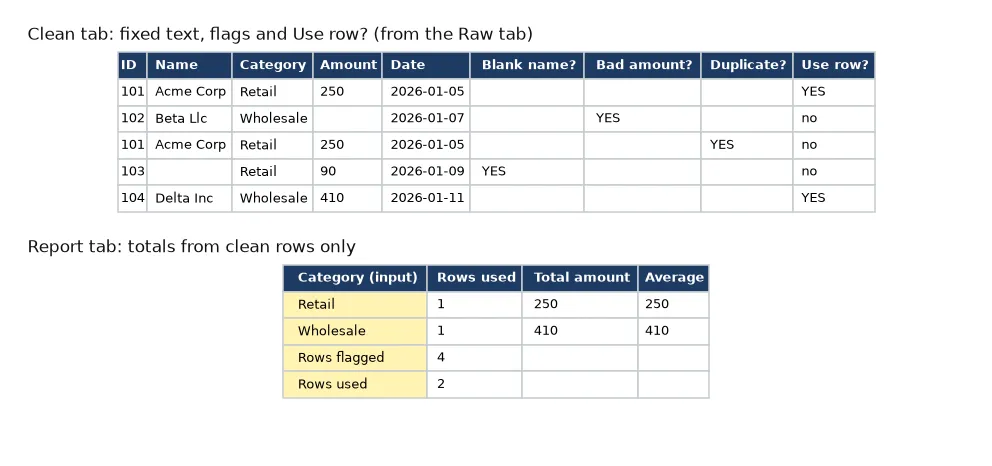
Data Cleaning & Summary Report
$7 USD · one-time payment
Trims and fixes text, flags blanks, non-numeric amounts and duplicates, then summarizes clean rows by category.
Paste a messy CRM, sales or expense export and get a cleaned copy plus category totals that skip the problem rows.
HIGHLIGHTS
- Trims stray spaces and fixes capitalization in names and categories
- Flags blank names, non-numeric amounts and repeated rows
- Marks each row usable or not, up to 500 rows
- Category totals and averages from clean rows only, with flagged and used counts
WHAT'S INCLUDED
- Raw tab: paste ID, Name, Category, Amount, Date
- Clean tab: fixed values and flags
- Report tab: totals by category
- Start Here tab
- Works in Excel, Google Sheets and LibreOffice; yellow cells are inputs, EXAMPLE rows show how it works
HOW TO USE
- Paste your rows into the Raw tab.
- Check the YES flags on the Clean tab and fix the source if needed.
- Type your category names on the Report tab to get totals.
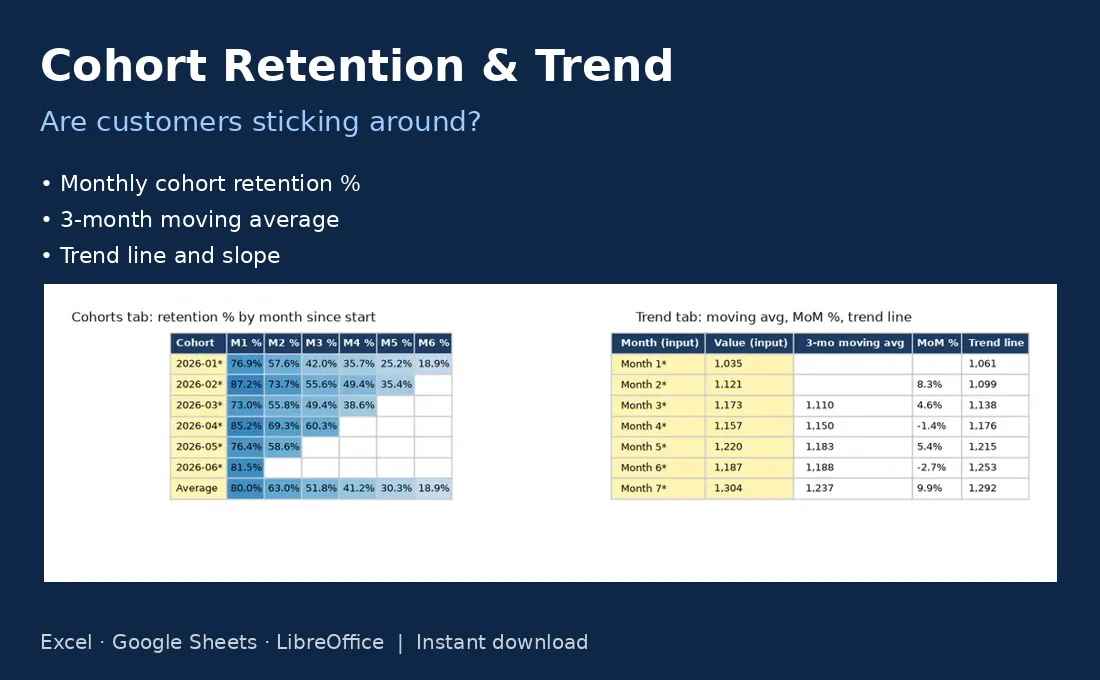
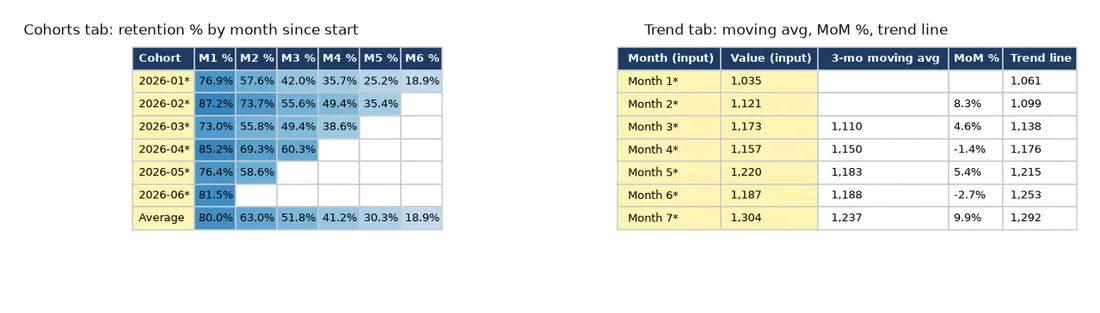
Cohort Retention & Trend Analysis
$9 USD · one-time payment
Monthly cohort retention grid plus a trend sheet with moving average, month-over-month change and linear trend.
See whether customers who joined in different months stick around, and whether a monthly number is truly rising once noise is smoothed out.
HIGHLIGHTS
- Retention % for each monthly cohort, up to six months after start
- Average retention row across cohorts
- Trend tab: 3-month moving average and month-over-month %
- Fitted trend line with slope per period, up to 24 months
WHAT'S INCLUDED
- Cohorts tab: start size and active counts, retention grid
- Trend tab: one monthly series with smoothing and trend
- Start Here tab
- Works in Excel, Google Sheets and LibreOffice; yellow cells are inputs, EXAMPLE rows show how it works
HOW TO USE
- Enter each cohort's starting count and later active counts.
- Enter one monthly series on the Trend tab.
- Compare cohort rows and read the slope for direction.
Decision support
Weighted Decision Matrix
$6 USD · one-time payment
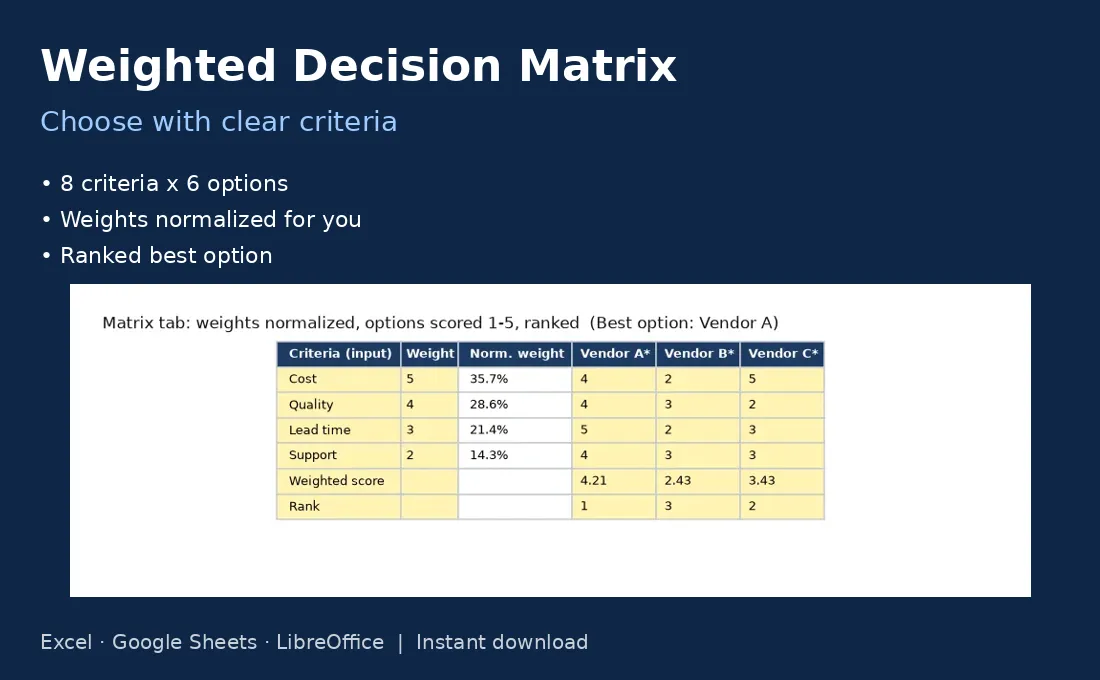
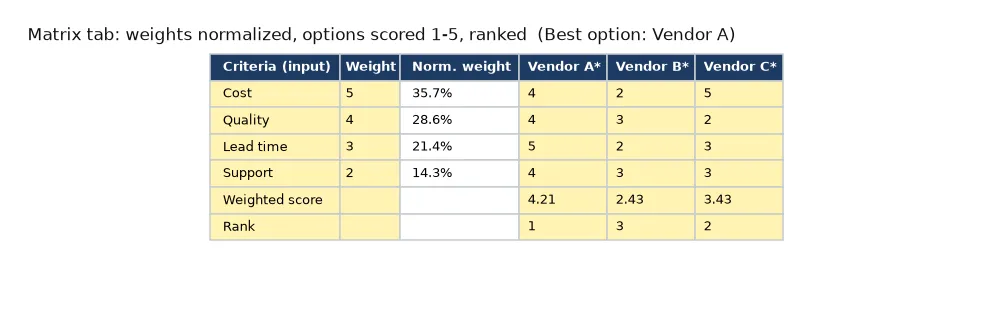
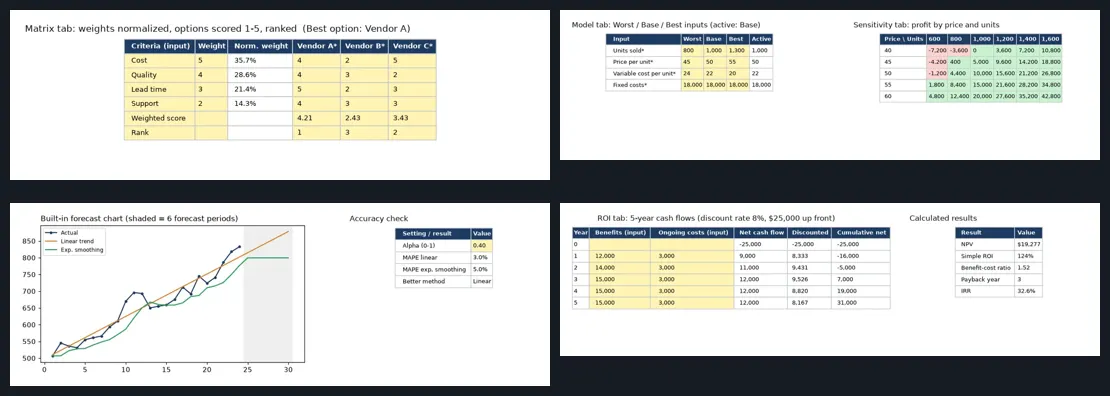
Score up to 6 options against 8 weighted criteria and see the ranked best option.
Make a choice between options explicit: agree on what matters and how much, score each option, and let the sheet rank them.
HIGHLIGHTS
- Up to 8 criteria with weights on any scale, normalized for you
- Up to 6 options scored 1-5 with input validation
- Weighted score and rank for every option
- Best option named; example compares three vendors
WHAT'S INCLUDED
- Matrix tab: criteria, weights, scores, ranks and best option
- Start Here tab
- Works in Excel, Google Sheets and LibreOffice; yellow cells are inputs, EXAMPLE rows show how it works
HOW TO USE
- List the criteria and give each a weight.
- Score every option 1-5 on each criterion.
- Read the rank and best option, then discuss close calls.
Scenario & What-If Model
$9 USD · one-time payment
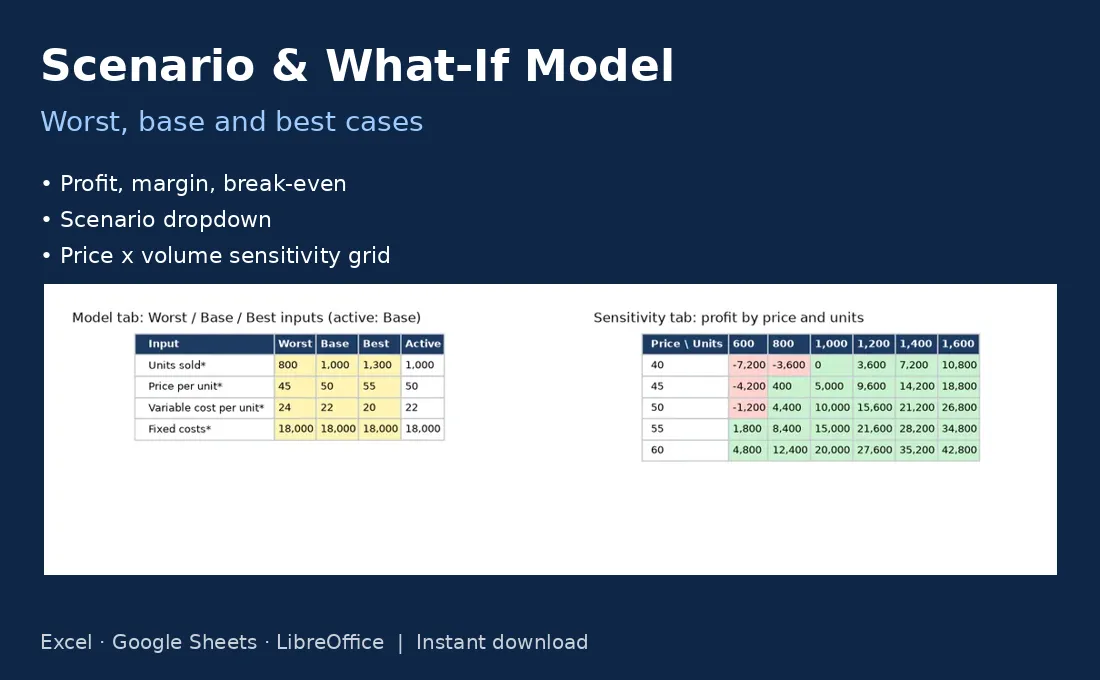
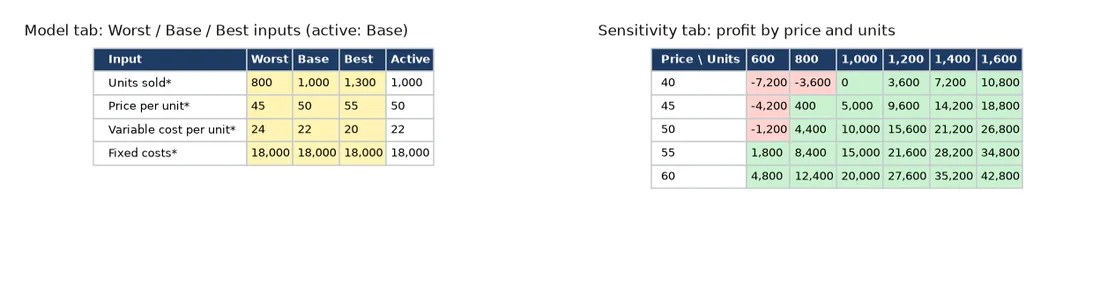
Worst, base and best cases with profit, margin, break-even and a price-by-volume sensitivity grid.
Answer "what if sales come in low?" before you commit, by comparing three cases and seeing how profit moves with price and volume.
HIGHLIGHTS
- Worst, Base and Best inputs for units, price, variable cost and fixed costs
- Dropdown to switch the active scenario
- Revenue, contribution, profit, margin and break-even update instantly
- 5 x 6 sensitivity grid of profit by price and units
WHAT'S INCLUDED
- Model tab: scenario inputs and results
- Sensitivity tab: profit grid
- Start Here tab
- Works in Excel, Google Sheets and LibreOffice; yellow cells are inputs, EXAMPLE rows show how it works
HOW TO USE
- Enter your worst, base and best assumptions.
- Switch the active scenario to compare results.
- Use the grid to spot price and volume pairs that lose money.
Simple Forecasting
$8 USD · one-time payment
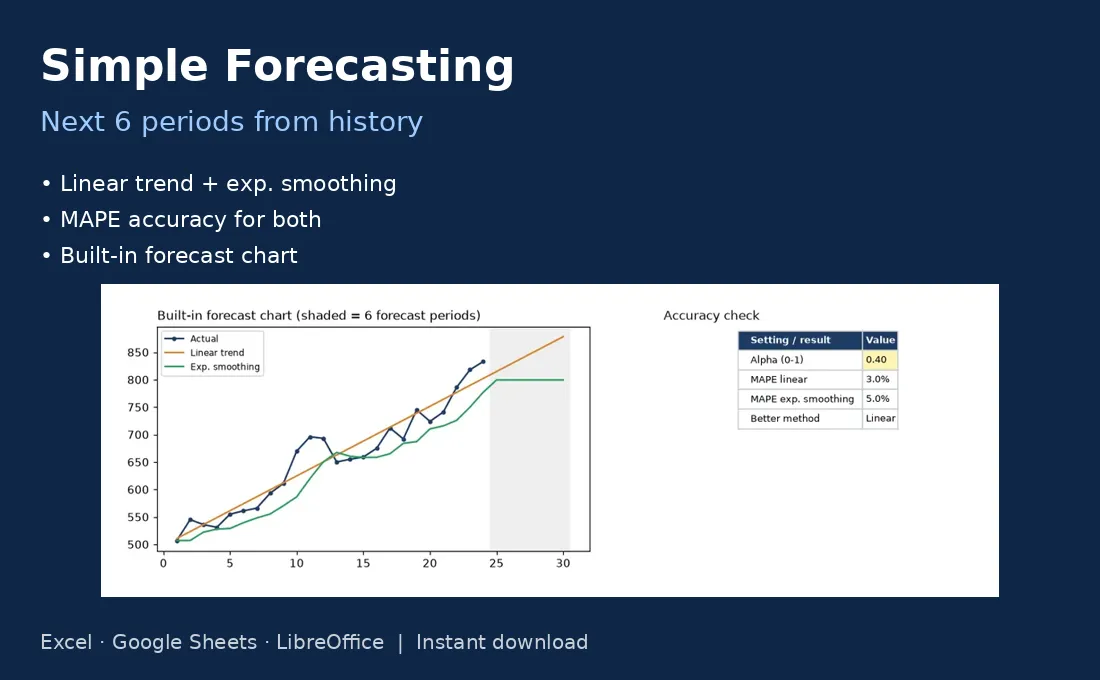
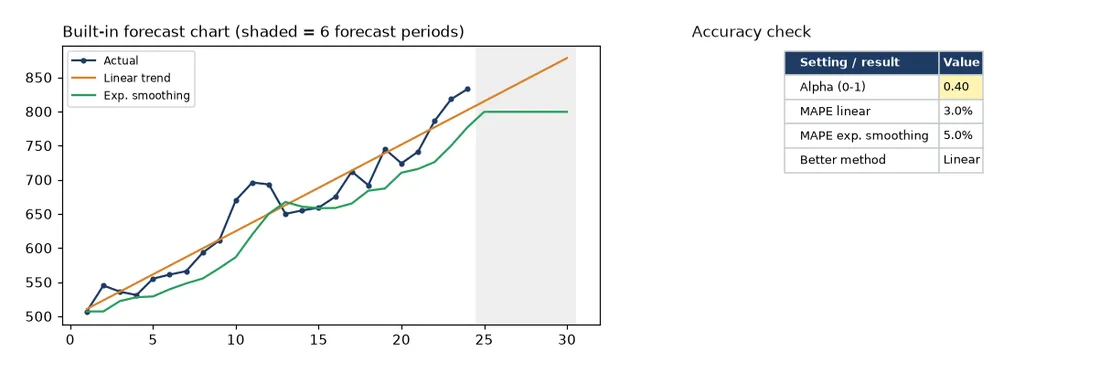
Linear trend and exponential smoothing forecasts, MAPE accuracy check and automatic best-method pick.
Get a defensible short-term forecast from monthly history, and learn which of two simple methods fits your past data better.
HIGHLIGHTS
- Linear trend forecast and exponential smoothing with adjustable alpha
- Absolute % error per period and MAPE for each method
- Better method picked automatically
- Built-in line chart; six forecast periods, history up to 24 points (minimum 6)
WHAT'S INCLUDED
- Forecast tab: history, both forecasts, errors, MAPE and chart
- Start Here tab
- Works in Excel, Google Sheets and LibreOffice; yellow cells are inputs, EXAMPLE rows show how it works
HOW TO USE
- Enter your monthly history in the Actual column.
- Adjust alpha to make smoothing react faster or slower.
- Use the method with the lower MAPE for the next six periods.
Cost-Benefit & ROI Calculator
$8 USD · one-time payment
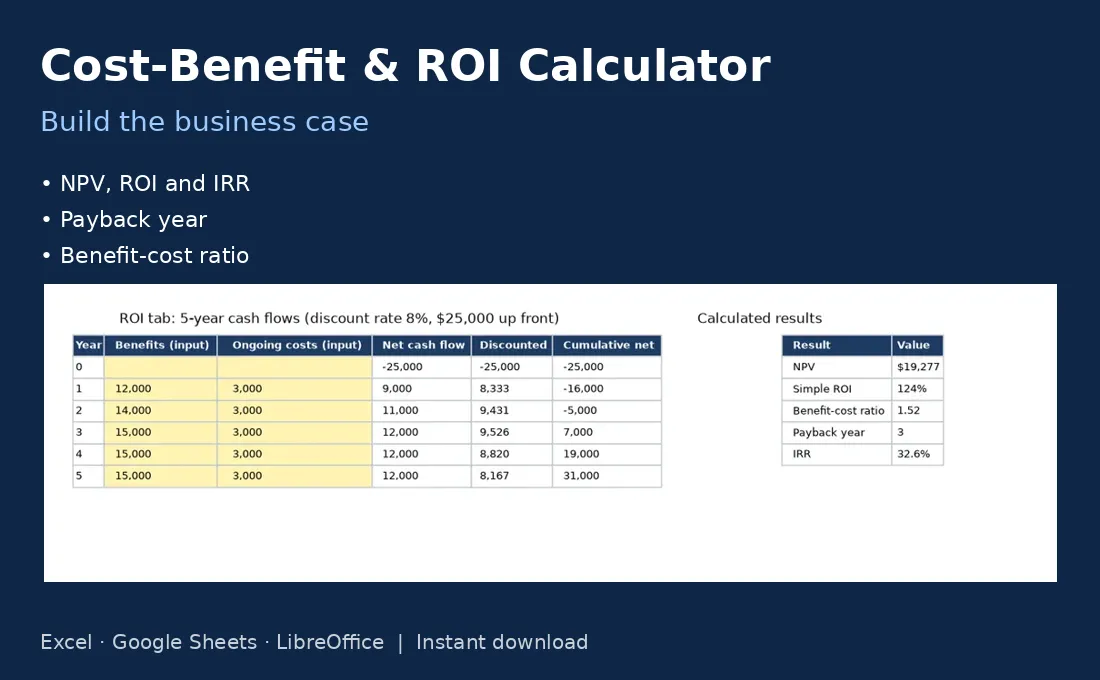
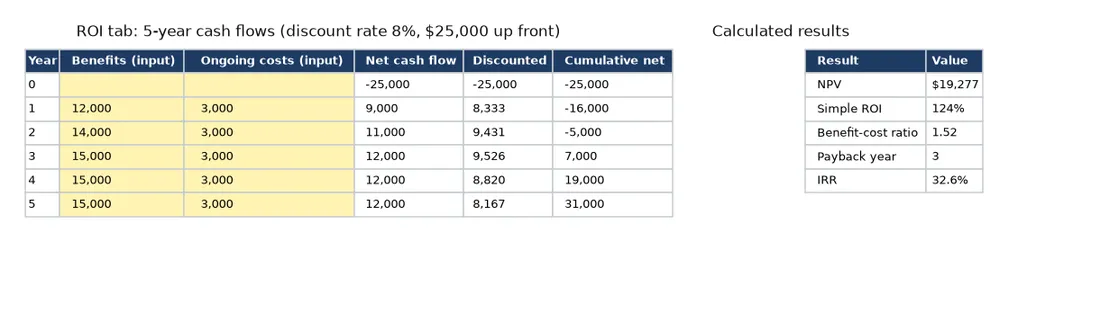
Five-year cash flows with NPV, ROI, benefit-cost ratio, payback year and IRR.
Put a proposed project or purchase into the numbers finance asks for, so the business case fits on one page.
HIGHLIGHTS
- One-time cost plus five years of benefits and ongoing costs
- Net, discounted and cumulative cash flow by year
- NPV, simple ROI and discounted benefit-cost ratio
- Payback year and IRR
WHAT'S INCLUDED
- ROI tab: inputs, cash flows and results
- Start Here tab
- Works in Excel, Google Sheets and LibreOffice; yellow cells are inputs, EXAMPLE rows show how it works
HOW TO USE
- Enter the up-front cost and your discount rate.
- Fill in each year's expected benefits and costs.
- Quote NPV, payback and IRR in your proposal.
Bundles
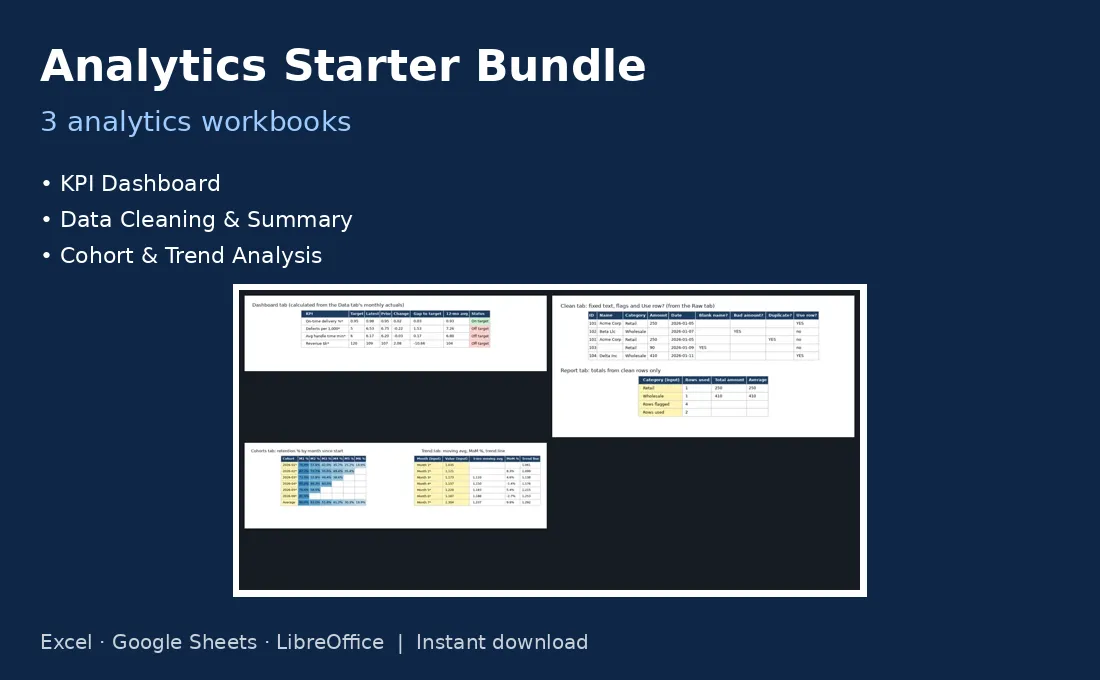
Analytics Starter Bundle
$19 USD · one-time payment
KPI Dashboard, Data Cleaning & Summary Report, and Cohort & Trend Analysis.
WHAT'S INCLUDED
- KPI Dashboard
- Data Cleaning & Summary Report
- Cohort Retention & Trend Analysis
Clean the data, track the monthly numbers, then check retention and trend.
Buy now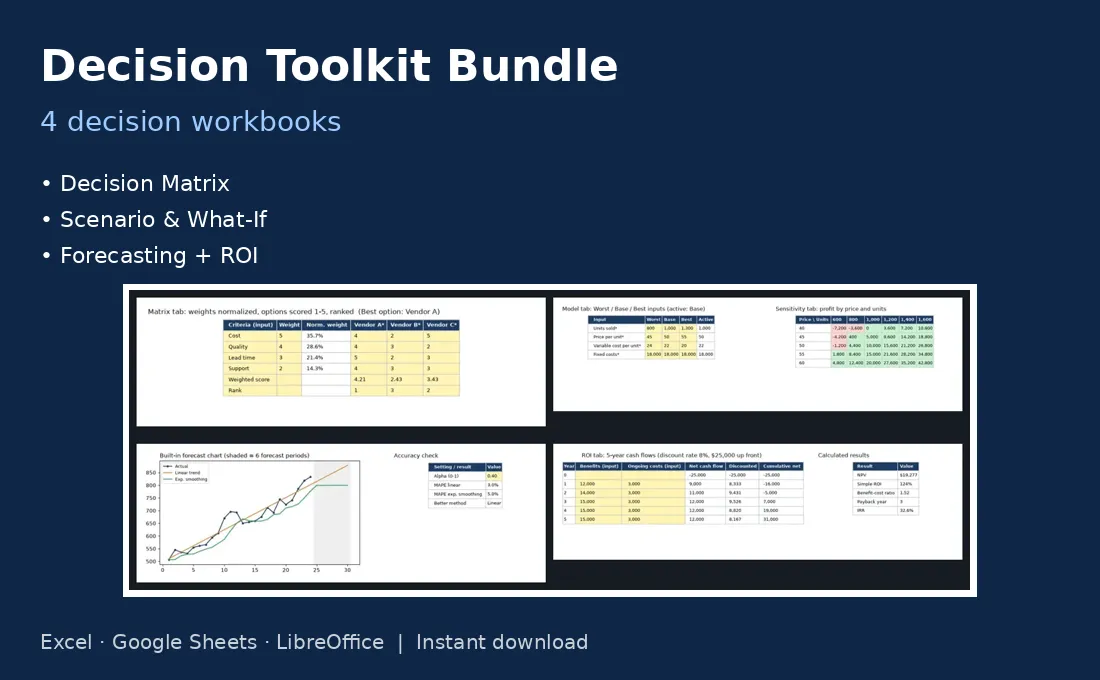
Decision Toolkit Bundle
$19 USD · one-time payment
Weighted Decision Matrix, Scenario & What-If, Simple Forecasting and Cost-Benefit & ROI.
WHAT'S INCLUDED
- Weighted Decision Matrix
- Scenario & What-If Model
- Simple Forecasting
- Cost-Benefit & ROI Calculator
Forecast demand, test scenarios, price the investment and compare the options.
Buy now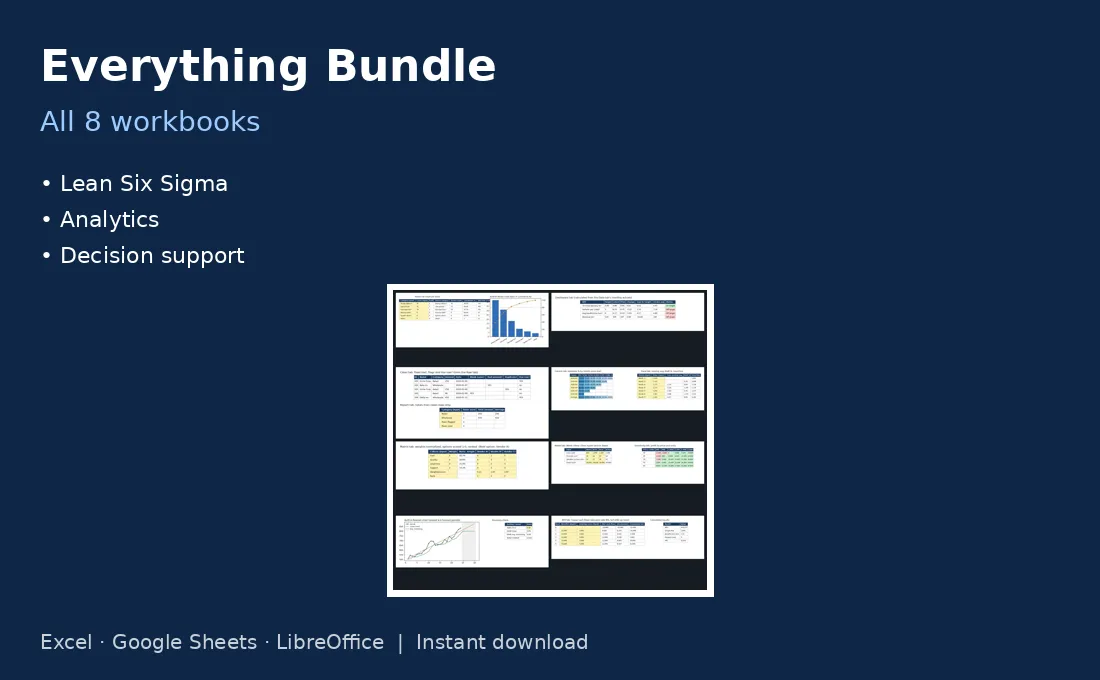
Everything Bundle
$49 USD · one-time payment
Every template in this store across Lean Six Sigma, analytics and decision support.
WHAT'S INCLUDED
- Pareto Analysis Calculator
- KPI Dashboard
- Data Cleaning & Summary Report
- Cohort Retention & Trend Analysis
- Weighted Decision Matrix
- Scenario & What-If Model
- Simple Forecasting
- Cost-Benefit & ROI Calculator
- DMAIC Project Toolkit (BLANK and EXAMPLE workbooks, guide PDF, slide templates, and the offline DMAIC Toolkit app with 56 tools)
- SPC & Capability workbook (BLANK and SAMPLE workbooks, guide PDF, and the offline SPC & Capability app)
Eight workbooks plus the DMAIC and SPC tools in one download.
Buy nowPurchase, refunds & terms
Checkout and payment are handled by Gumroad. Prices are one-time payments in USD; your download link is emailed right after purchase. Because these are digital downloads, sales are generally final, but if a file is faulty or not as described, email us within 30 days for a fix or a refund. Templates are licensed for your personal or internal business use and may not be resold.
Contact
Questions or support: [email protected]